Fig. 10
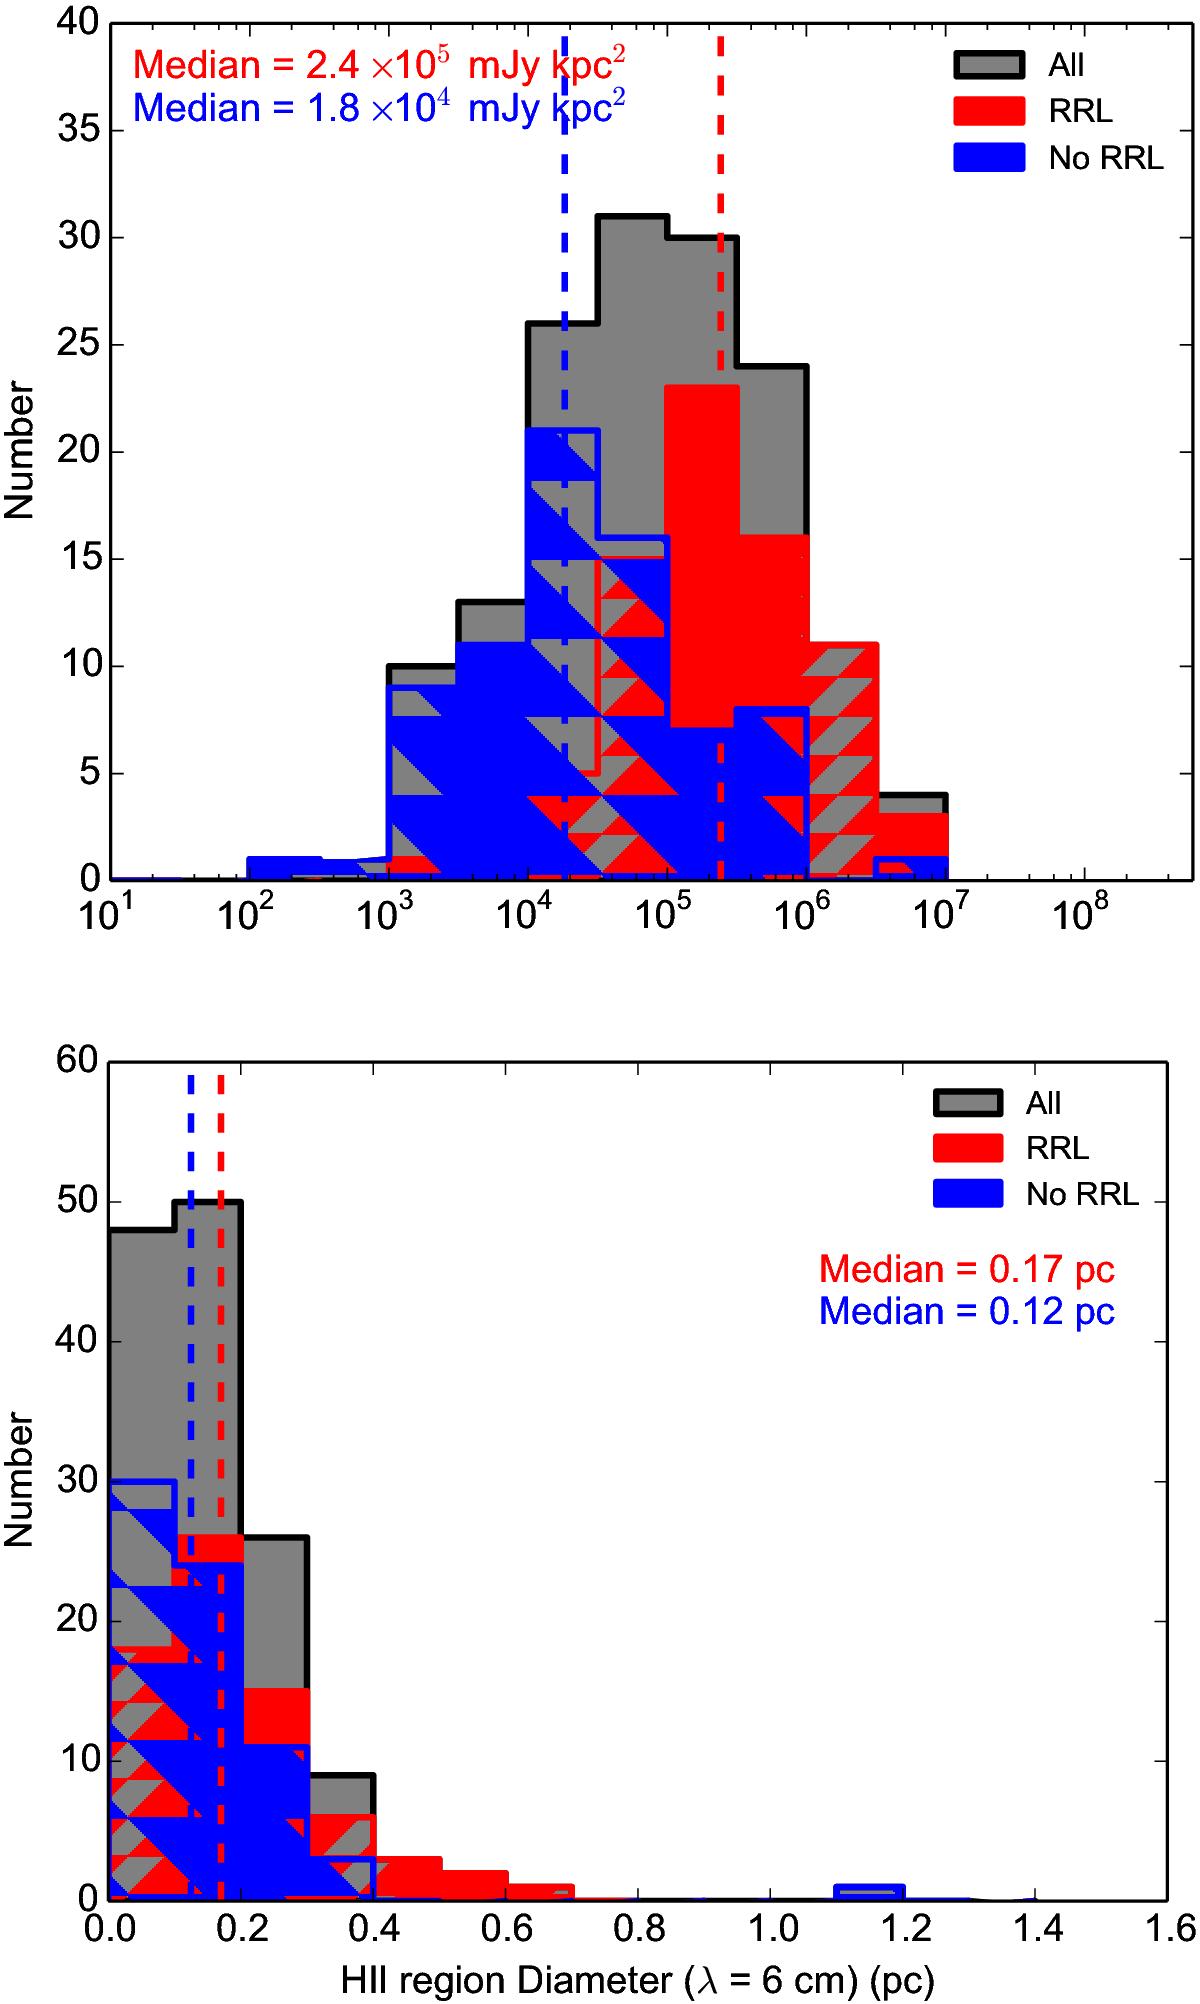
Upper panel: radio continuum luminosity for sources with and without mm-RRL emission. The bin size is 0.5 dex. Lower panel: H ii region diameters. The bin size is 0.1 pc. The blue and red dashed lines indicate median values of the radio continuum luminosity and H ii region diameter for mm-RRL and non mm-RRL sources. The gray histograms of both plots show the distributions of the full sample.
Current usage metrics show cumulative count of Article Views (full-text article views including HTML views, PDF and ePub downloads, according to the available data) and Abstracts Views on Vision4Press platform.
Data correspond to usage on the plateform after 2015. The current usage metrics is available 48-96 hours after online publication and is updated daily on week days.
Initial download of the metrics may take a while.