Fig. 1
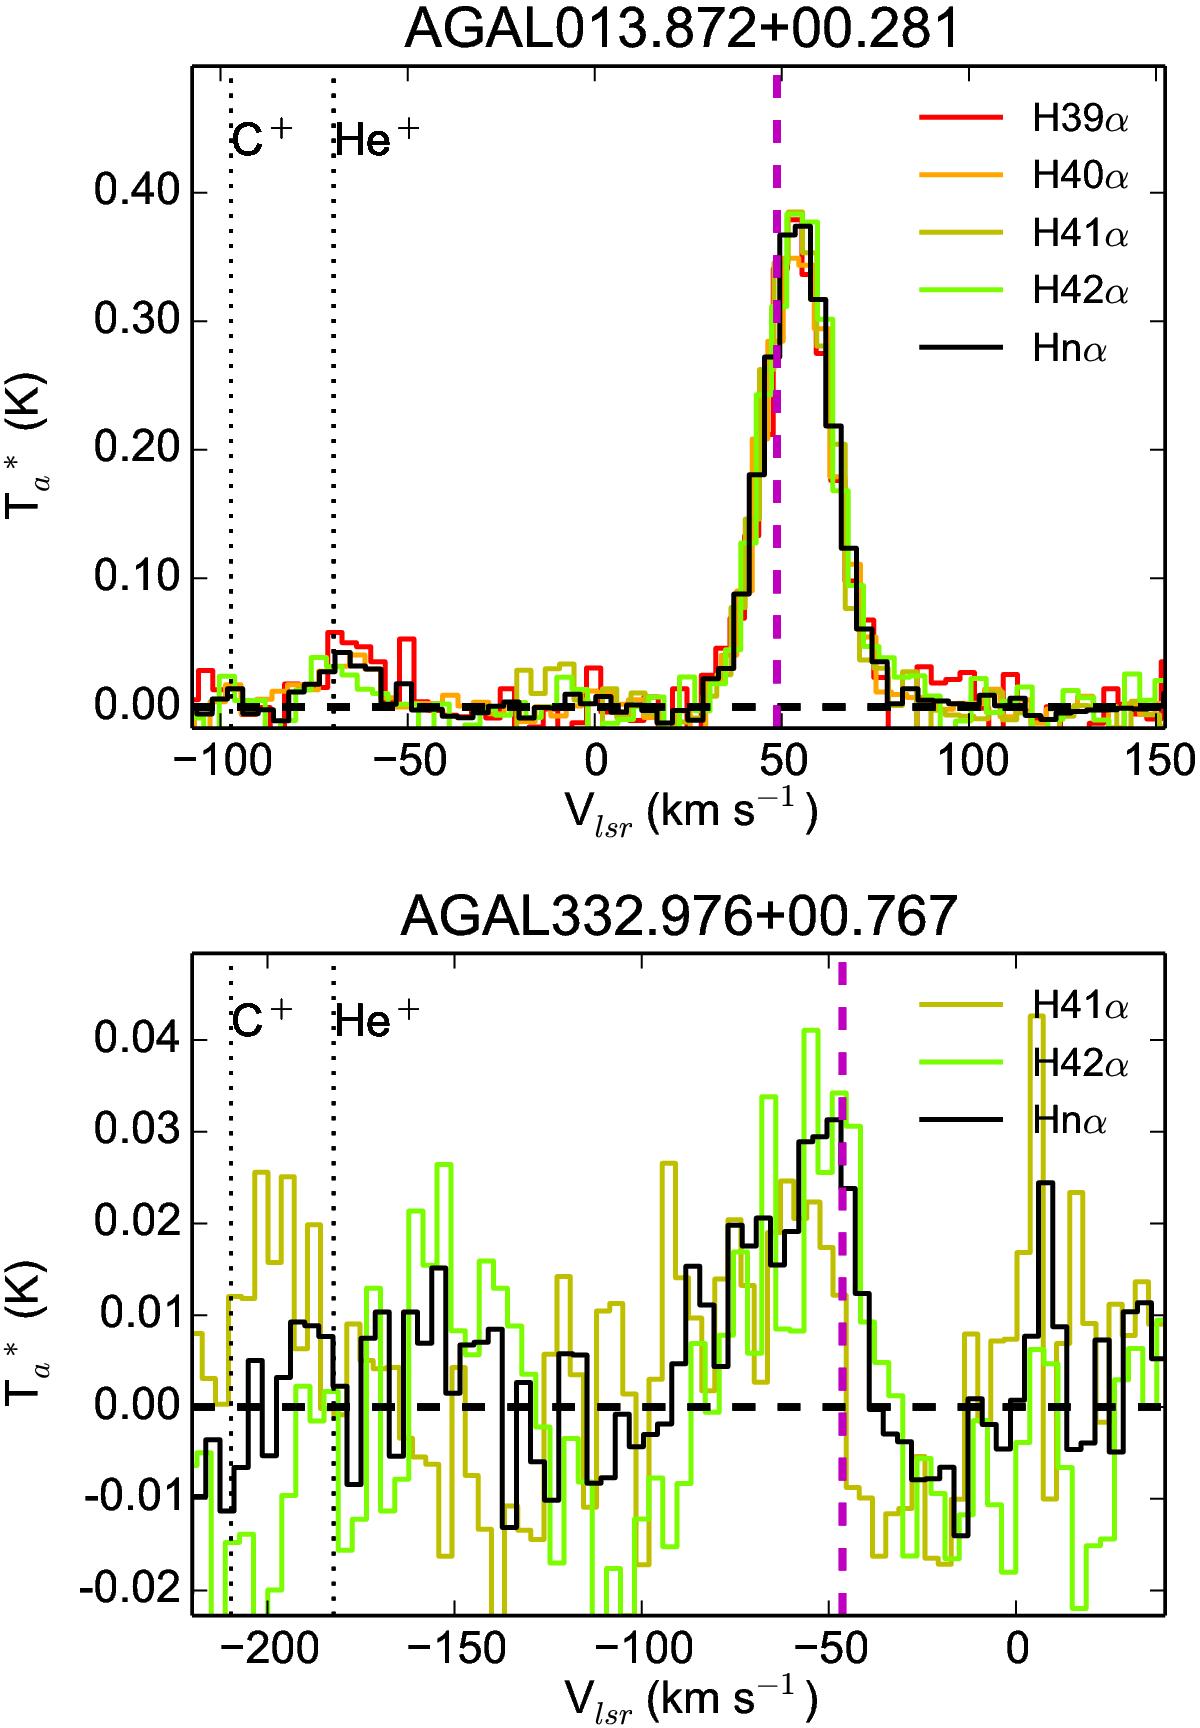
For two sources in our sample, each color represents an observed RRL Hnα transition and the black line shows the stacked spectrum. The purple dashed lines indicate the systemic local standard of rest (lsr) velocity of the clump determined from the H13CO+(1−0) transition and the two vertical black dotted lines indicate expected positions of helium and carbon RRLs.
Current usage metrics show cumulative count of Article Views (full-text article views including HTML views, PDF and ePub downloads, according to the available data) and Abstracts Views on Vision4Press platform.
Data correspond to usage on the plateform after 2015. The current usage metrics is available 48-96 hours after online publication and is updated daily on week days.
Initial download of the metrics may take a while.