Fig. 9
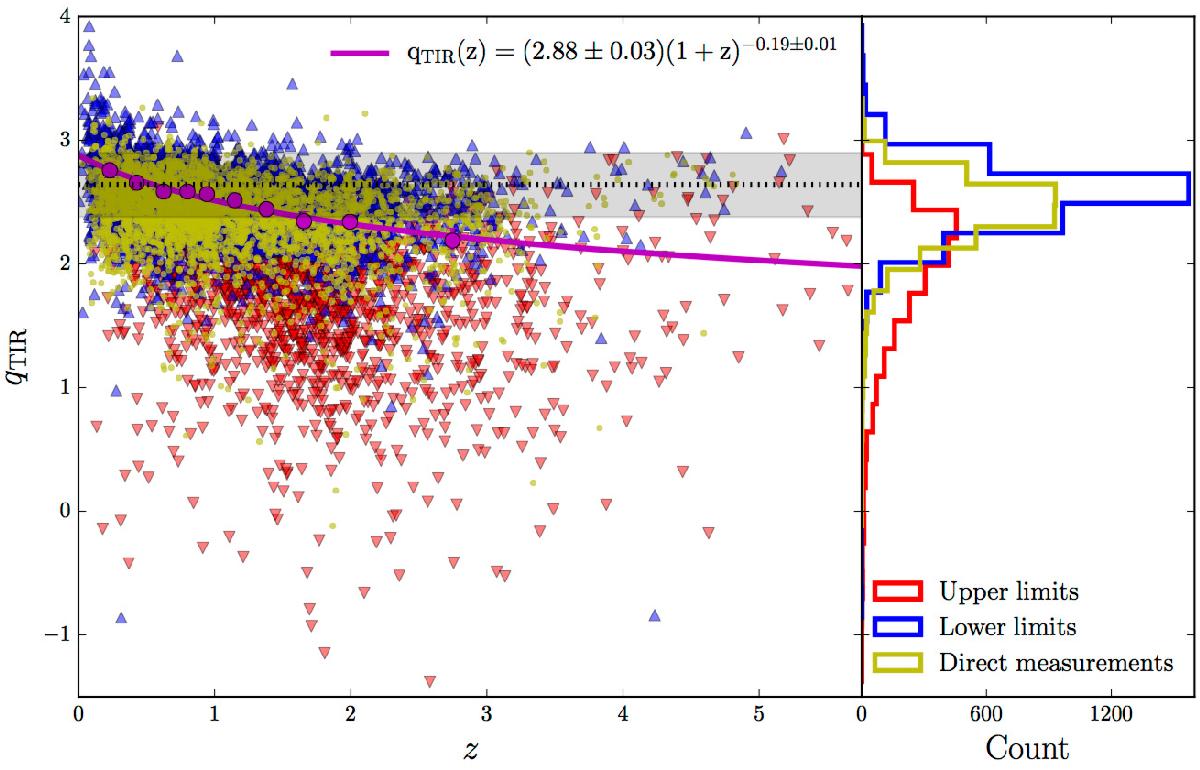
IRRC (qTIR) versus redshift for star-forming galaxies. Objects with detections in both the infrared and radio have directly-constrained values of qTIR and are shown as yellow points. Objects only detected in the radio are upper limits and shown as red triangles. Objects only detected in the infrared are lower limits and shown as blue triangles. A doubly-censored survival analysis has been used to calculate the median qTIR within redshift bins, indicated by the magenta points. Error bars (smaller than the magenta points here) represent the 1σ dispersion calculated via the bootstrap method. The magenta line shows the power-law fit to these. The black dotted line and grey shaded area are the local value of Bell (2003) (qTIR(zt0) = 2.64 ± 0.02) and associated spread (0.26), respectively. In the right-hand panel, the qTIR distribution is shown separately for direct measurements, upper limits and lower limits.
Current usage metrics show cumulative count of Article Views (full-text article views including HTML views, PDF and ePub downloads, according to the available data) and Abstracts Views on Vision4Press platform.
Data correspond to usage on the plateform after 2015. The current usage metrics is available 48-96 hours after online publication and is updated daily on week days.
Initial download of the metrics may take a while.