Fig. 8
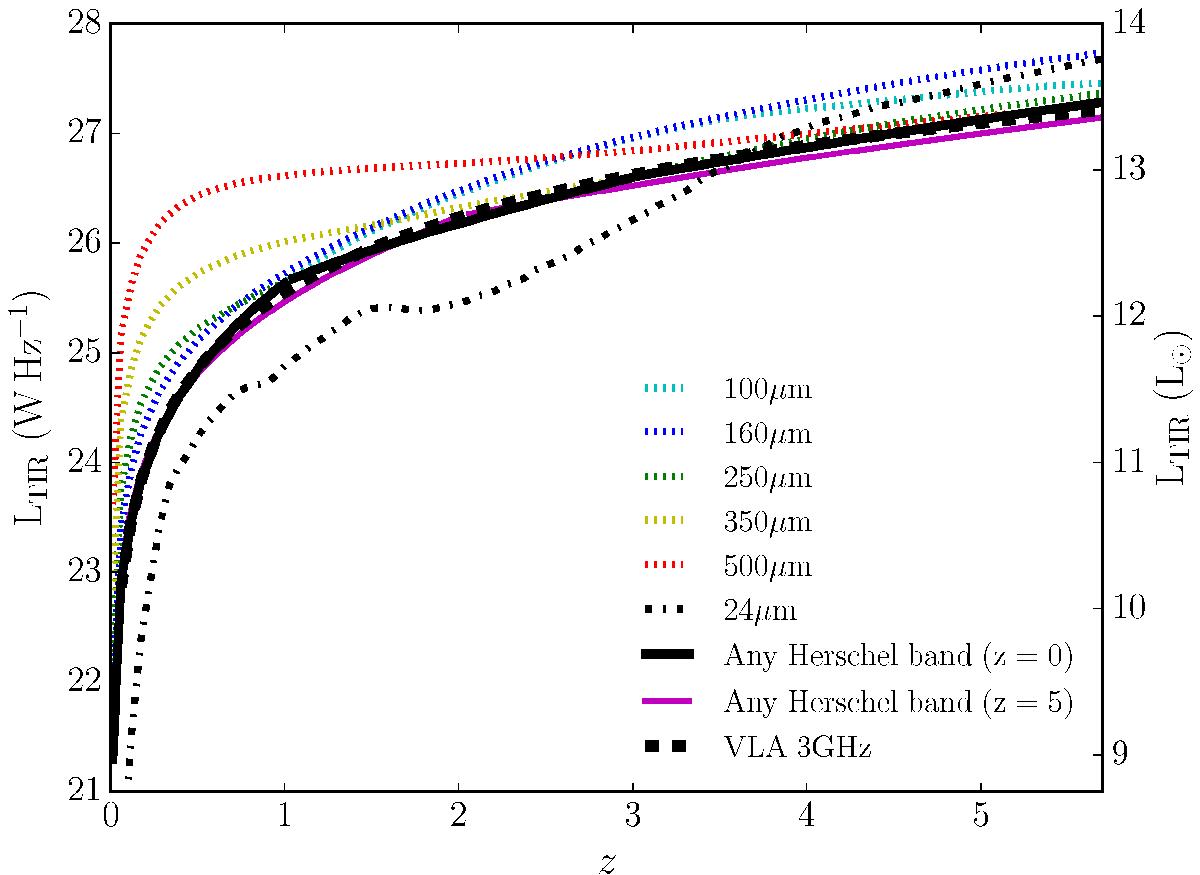
Total infrared luminosity limit of various data sets. Dashed, coloured lines show the limit in various Herschel bands assuming a z = 0 galaxy template (see text, Sect. 2.3.4, for details). The black line traces the lowest coloured line at each redshift and represents the sensitivity limit of the infrared-selected sample. The magenta line is the equivalent using z = 5 templates. The 5σ sensitivity limit of the Spitzer 24 μm data is shown as the black dot-dashed line. The sensitivity limit of the VLA 3 GHz Large Project (dashed black line) is also shown, assuming qTIR = 2.64 (Bell 2003) and a radio spectral index of α = − 0.7.
Current usage metrics show cumulative count of Article Views (full-text article views including HTML views, PDF and ePub downloads, according to the available data) and Abstracts Views on Vision4Press platform.
Data correspond to usage on the plateform after 2015. The current usage metrics is available 48-96 hours after online publication and is updated daily on week days.
Initial download of the metrics may take a while.