Fig. 6
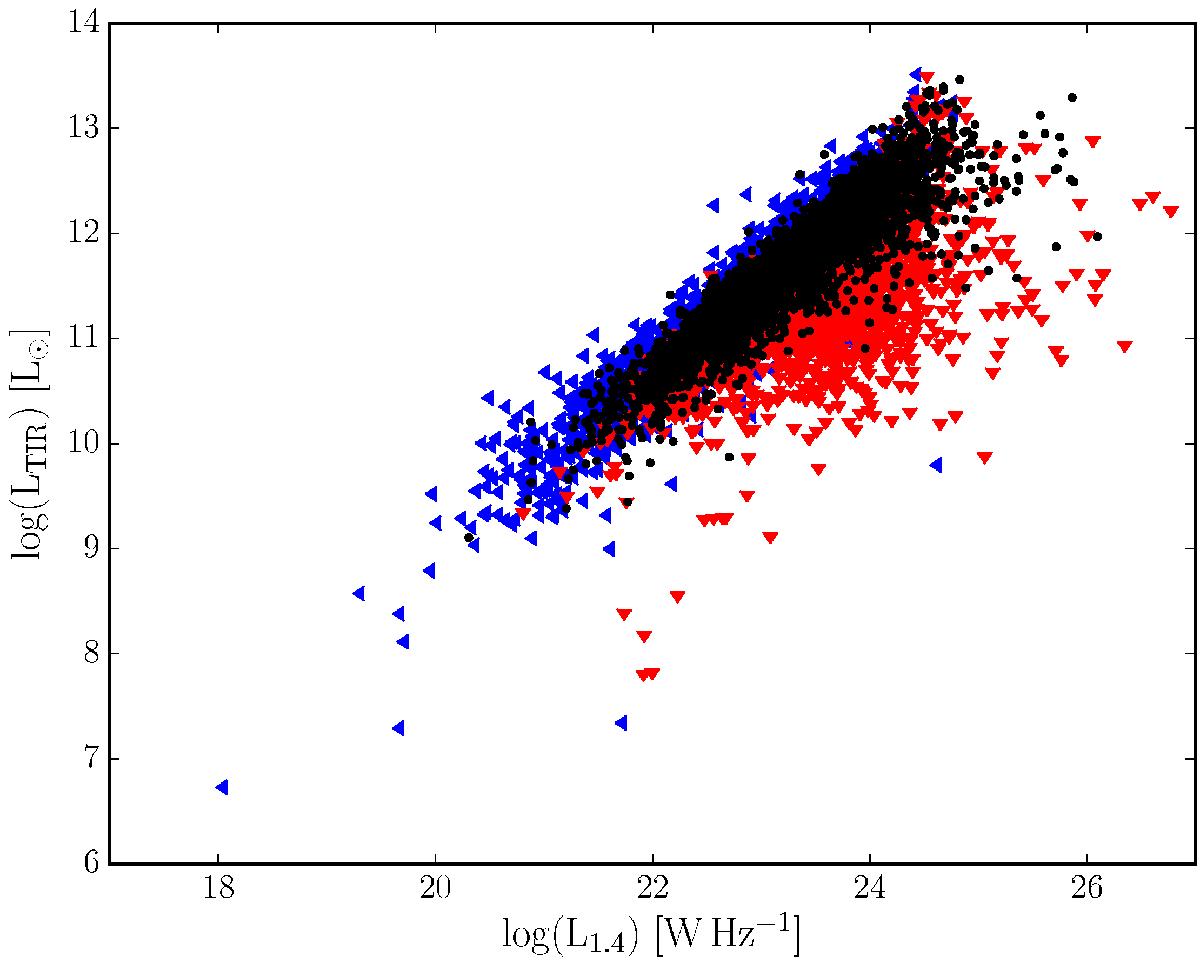
Total infrared versus 1.4 GHz luminosity for star-forming objects in the jointly-selected sample. Black points show objects directly detected in both the radio and infrared data, red arrows indicate objects in the radio-detected sample with upper limits in the infrared and blue arrows indicate objects in the infrared-detected sample with upper limits in the radio.
Current usage metrics show cumulative count of Article Views (full-text article views including HTML views, PDF and ePub downloads, according to the available data) and Abstracts Views on Vision4Press platform.
Data correspond to usage on the plateform after 2015. The current usage metrics is available 48-96 hours after online publication and is updated daily on week days.
Initial download of the metrics may take a while.