Fig. 4
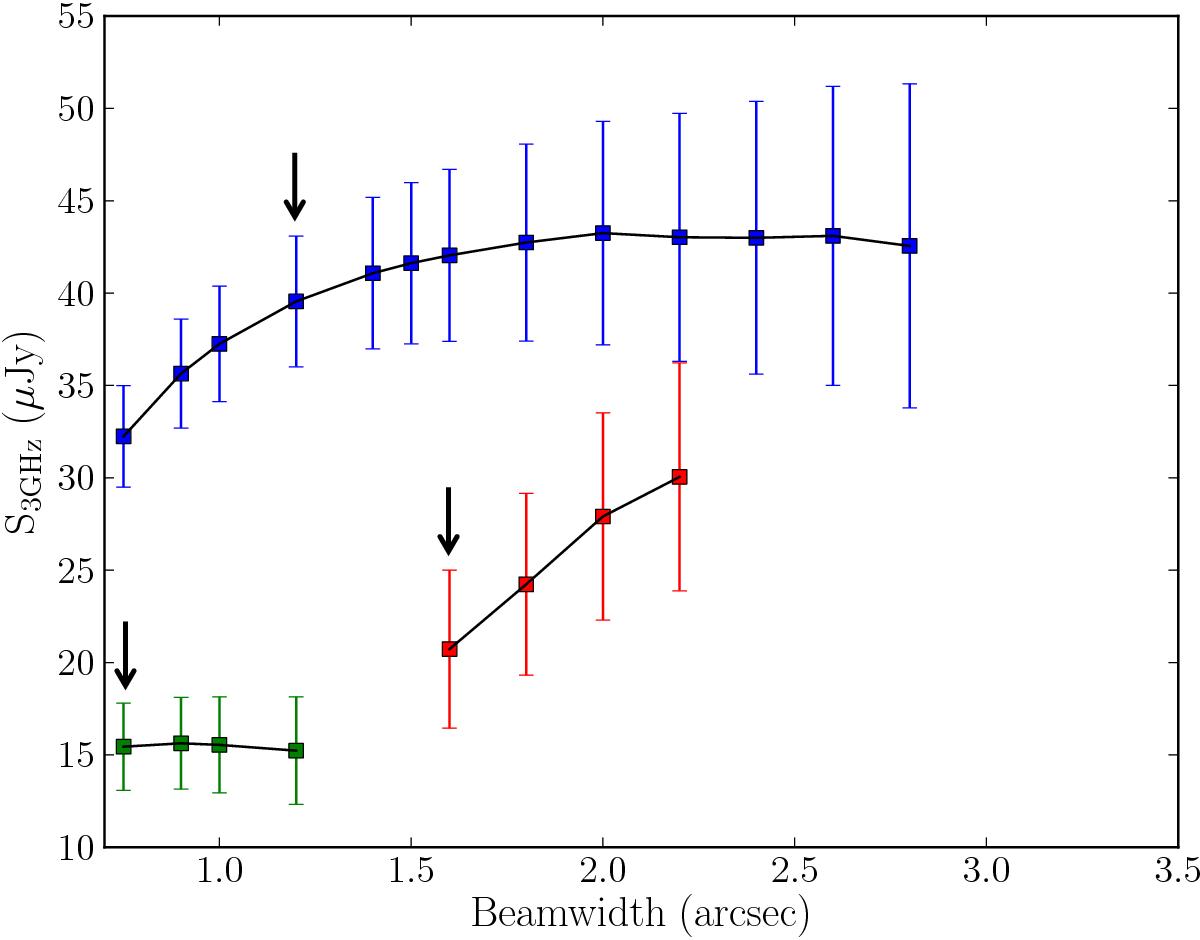
3 GHz peak flux measured in each convolved 3 GHz map for three different objects with 1σ error bars. Fluxes associated with a given object are colour-coded and joined by a line. In each case, the indicated point shows where the flux ceases to change significantly with increasing convolution. The mosaic resolution at which this occurs is considered optimal. See text (Sect. 2.3.2) for further details.
Current usage metrics show cumulative count of Article Views (full-text article views including HTML views, PDF and ePub downloads, according to the available data) and Abstracts Views on Vision4Press platform.
Data correspond to usage on the plateform after 2015. The current usage metrics is available 48-96 hours after online publication and is updated daily on week days.
Initial download of the metrics may take a while.