Fig. 19
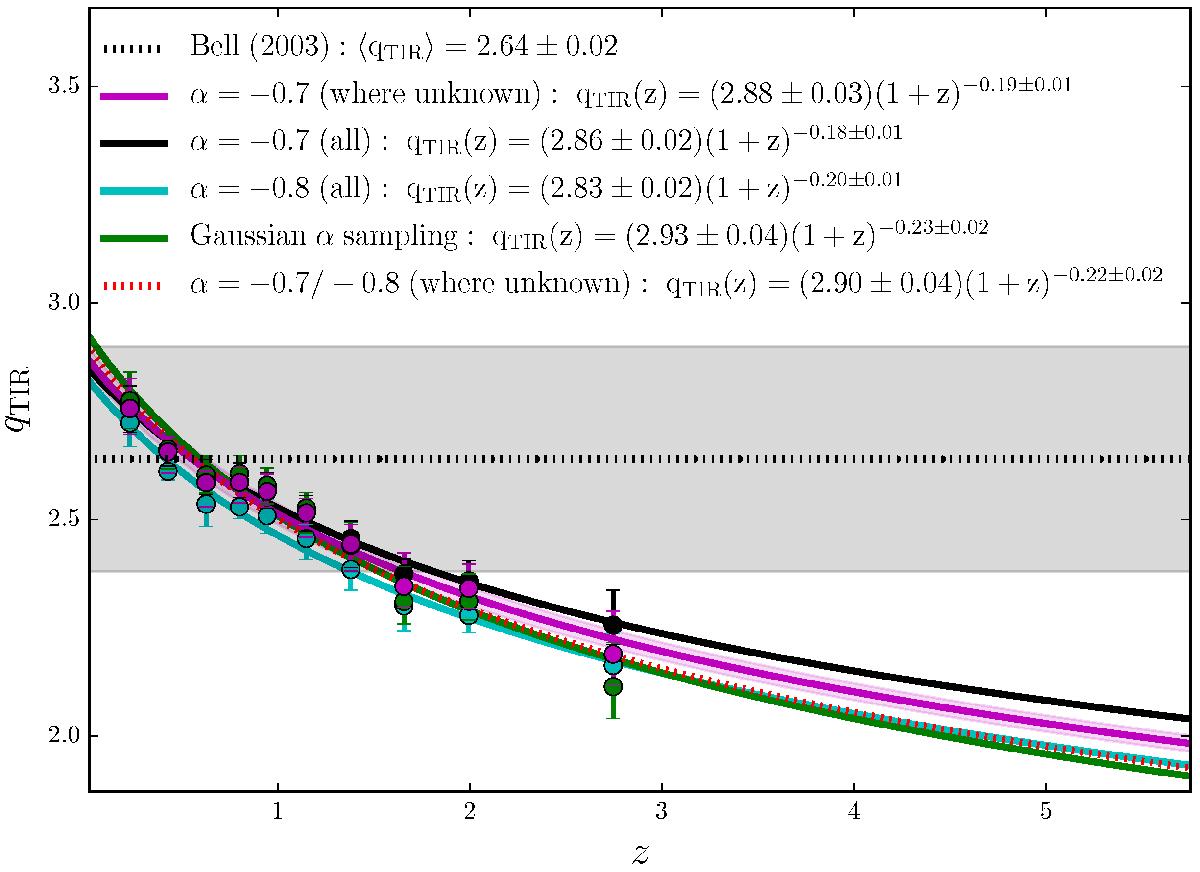
Evolution of the IRRC found when using (i) the real spectral index, where it is known, otherwise using α = − 0.7 (magenta; 1σ uncertainty region shaded); (ii) a spectral index of α = − 0.7 for all sources (black); and (iii) a spectral index of α = − 0.8 for all sources (cyan). The green points and line show the result of sampling α (where it is unknown) from a Gaussian distribution with μ = − 0.7 and σ = 0.35. The red dashed line shows the use of α = − 0.7 (at z< 2) and − 0.8 (at z> 2) where it is unknown.
Current usage metrics show cumulative count of Article Views (full-text article views including HTML views, PDF and ePub downloads, according to the available data) and Abstracts Views on Vision4Press platform.
Data correspond to usage on the plateform after 2015. The current usage metrics is available 48-96 hours after online publication and is updated daily on week days.
Initial download of the metrics may take a while.