Free Access
Fig. 18
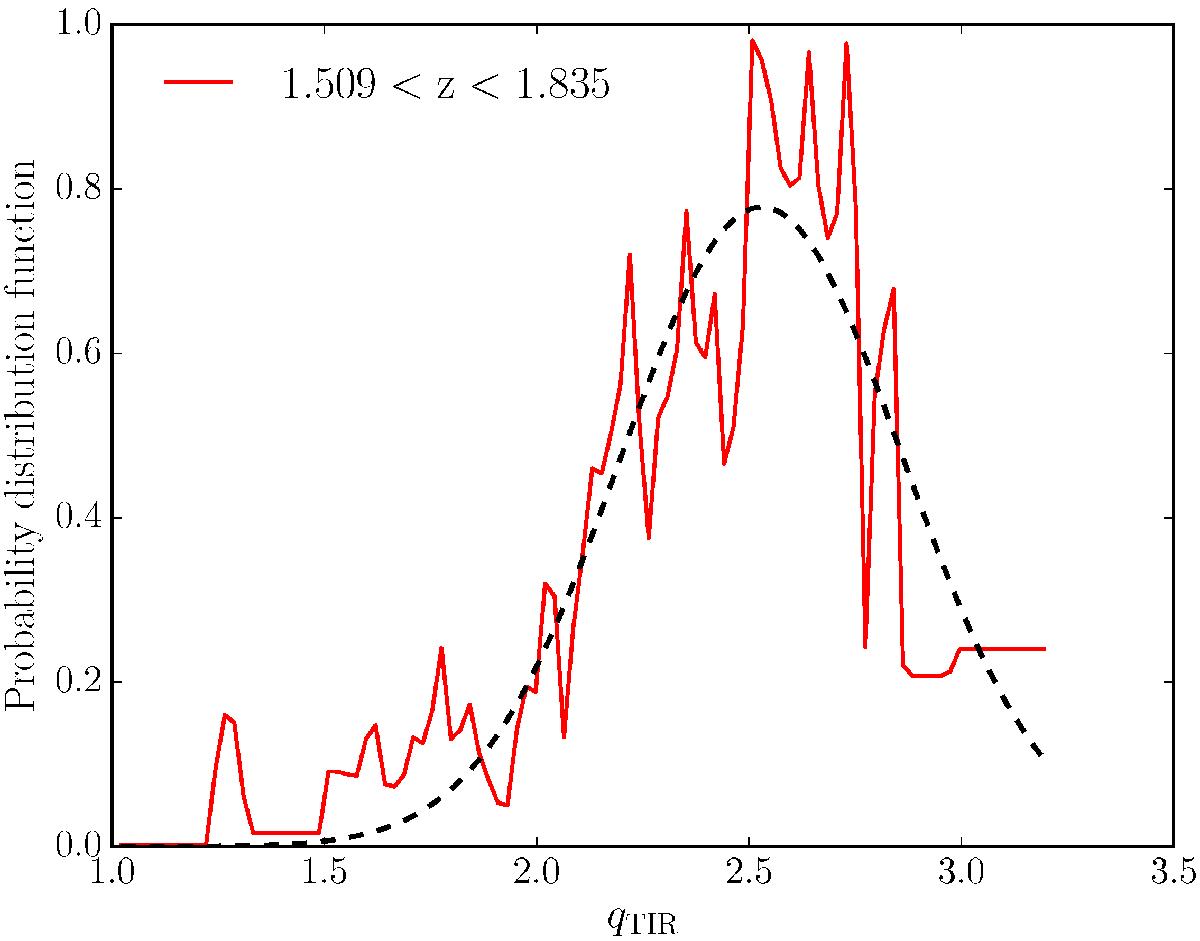
Probability distribution in a given redshift bin used to identify objects with radio-excess. The probability distribution function (red line) is generated by taking the derivative of the survival function (a cumulative distribution) in a given redshift bin and is fitted with a Gaussian function (black dashed line).
Current usage metrics show cumulative count of Article Views (full-text article views including HTML views, PDF and ePub downloads, according to the available data) and Abstracts Views on Vision4Press platform.
Data correspond to usage on the plateform after 2015. The current usage metrics is available 48-96 hours after online publication and is updated daily on week days.
Initial download of the metrics may take a while.