Free Access
Fig. 17
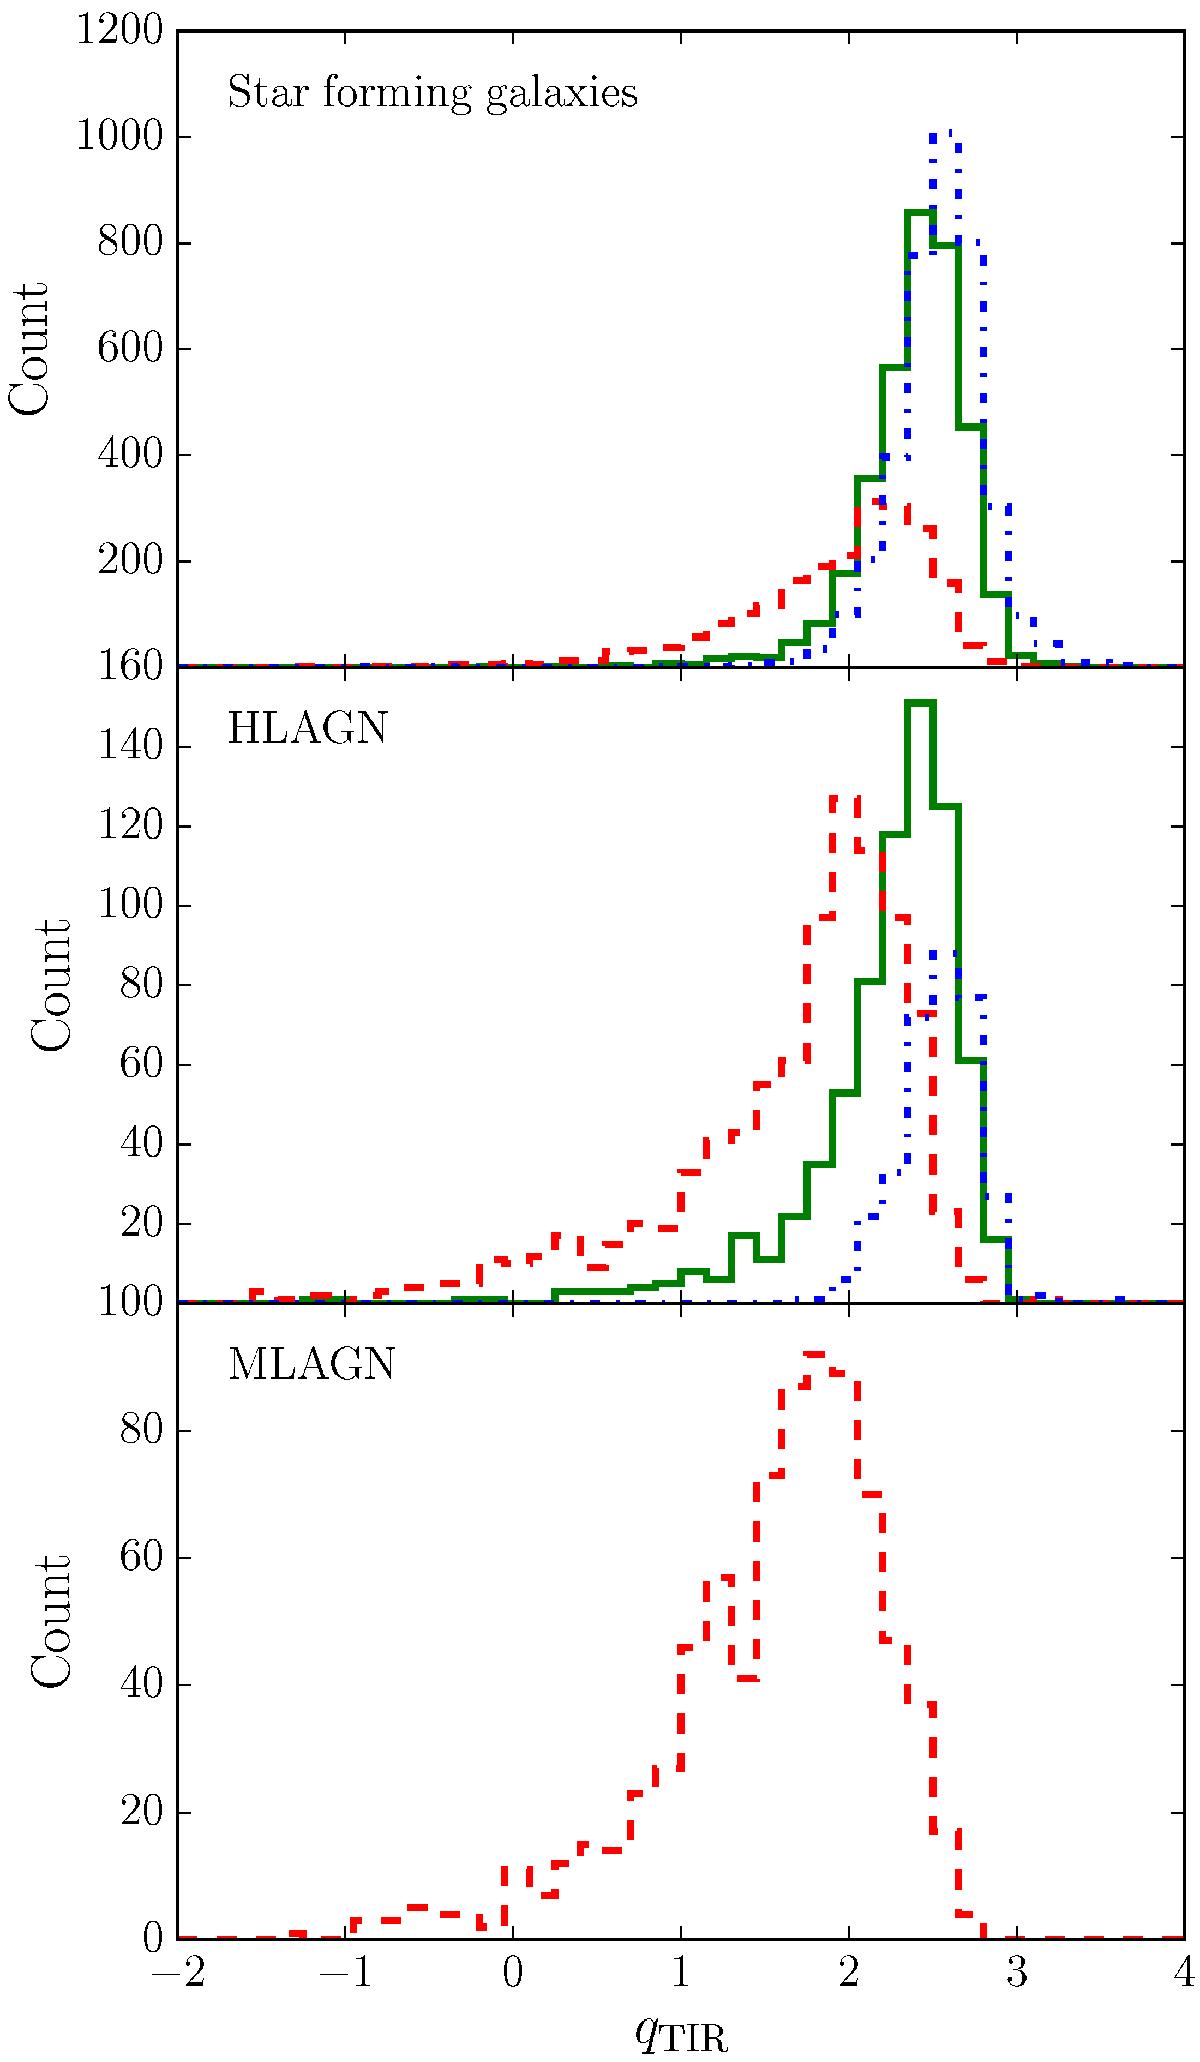
Distribution of direct qTIR measurements (solid green line), lower limits (blue dot-dashed line) upper limits (red dashed line) shown separately for the populations of star-forming galaxies, HLAGN and MLAGN, as indicated.
Current usage metrics show cumulative count of Article Views (full-text article views including HTML views, PDF and ePub downloads, according to the available data) and Abstracts Views on Vision4Press platform.
Data correspond to usage on the plateform after 2015. The current usage metrics is available 48-96 hours after online publication and is updated daily on week days.
Initial download of the metrics may take a while.