Fig. 16
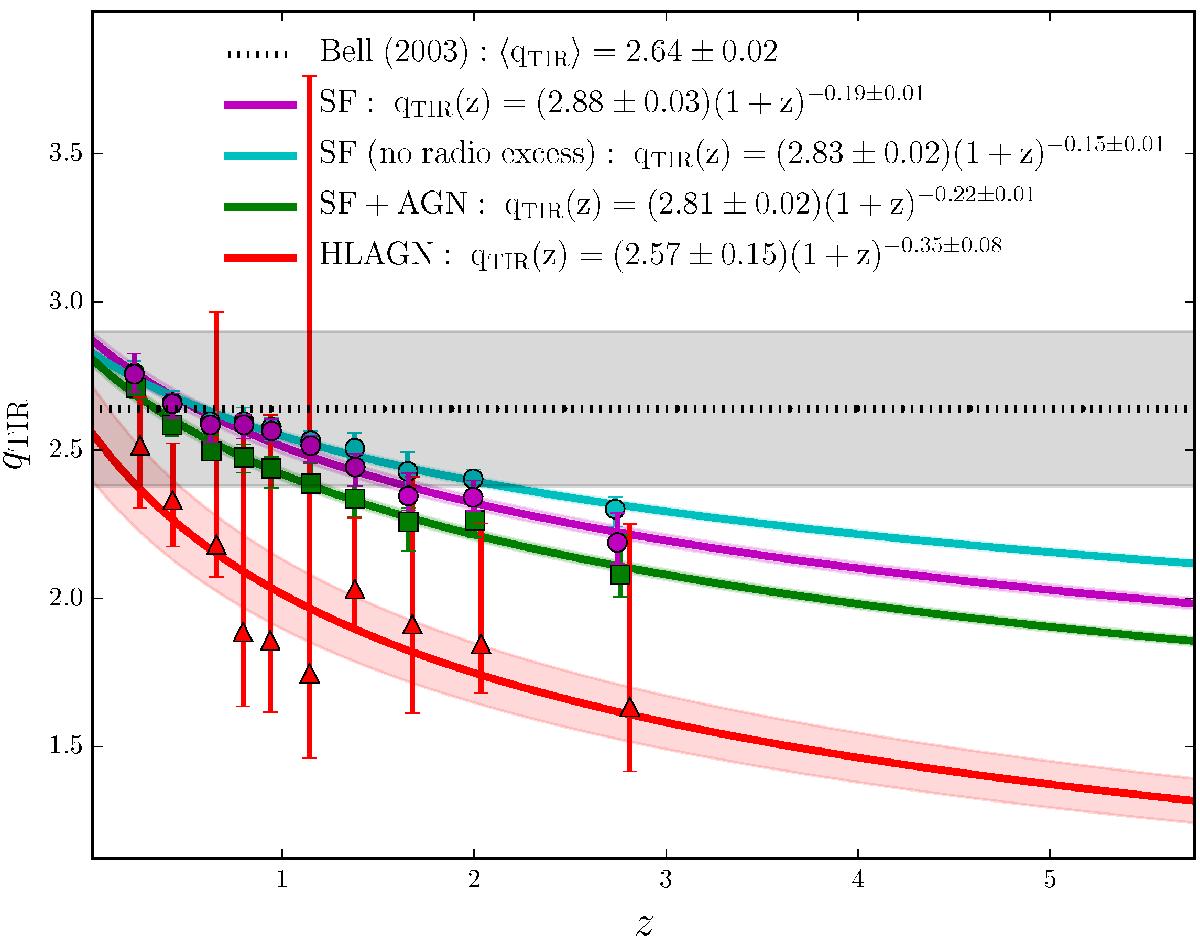
Evolution of the IRRC for different source populations. The magenta curve (and points) is the power-law relation found for star-forming galaxies only, while the green curve (and squares) is that found when AGN are included (i.e. star-forming galaxies plus all AGN). The red curve (and triangles) is found when only HLAGN are considered. The cyan curve (and points) is found for the star-forming population of galaxies, excluding those with radio excess. See text (Sect. 4.3.3) for the definition of radio excess. Shading shows the 1σ uncertainty regions.
Current usage metrics show cumulative count of Article Views (full-text article views including HTML views, PDF and ePub downloads, according to the available data) and Abstracts Views on Vision4Press platform.
Data correspond to usage on the plateform after 2015. The current usage metrics is available 48-96 hours after online publication and is updated daily on week days.
Initial download of the metrics may take a while.