Fig. 14
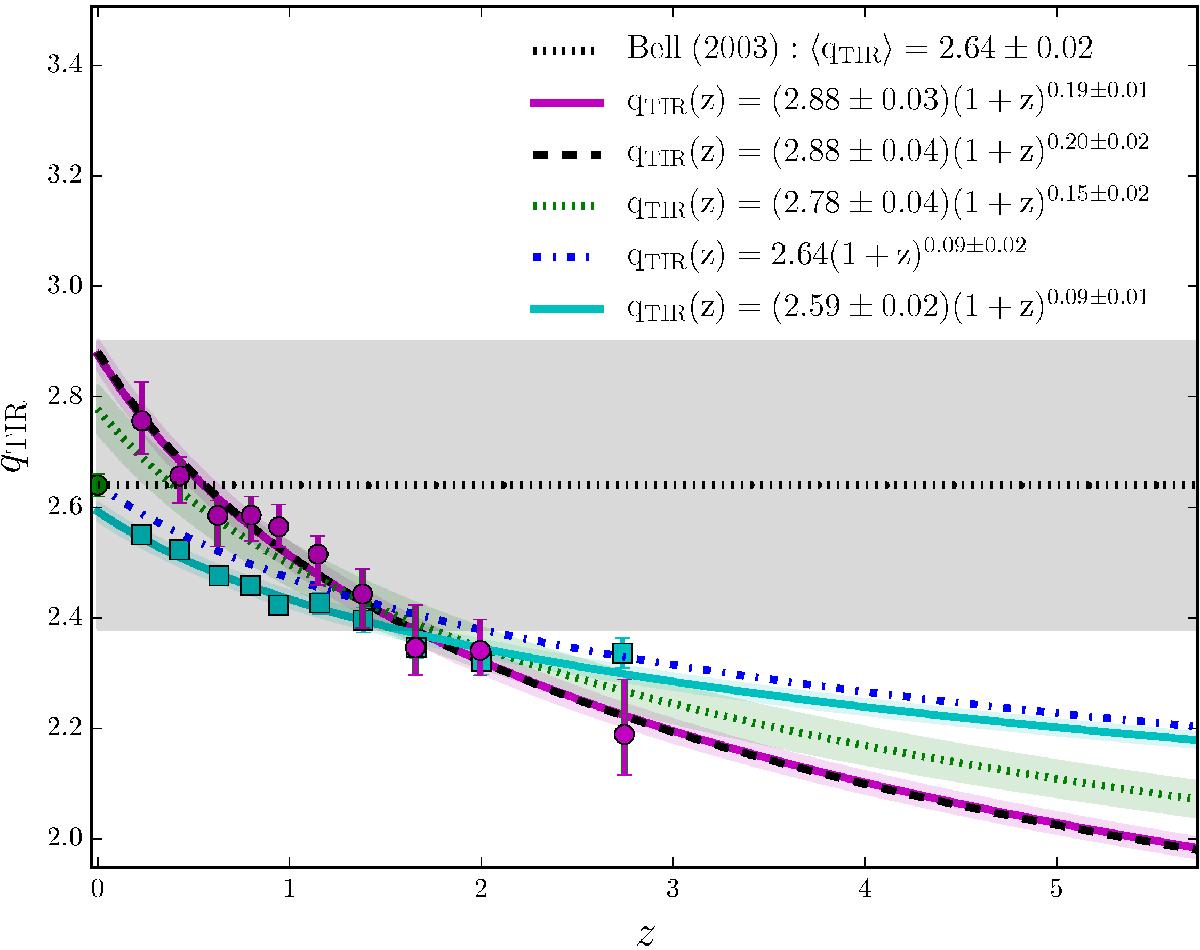
qTIR versus redshift for star-forming galaxies and associated power-law fits derived using: all data points (magenta points and solid line; 1σ uncertainty region shaded), excluding the lowest redshift bin (black dashed line), including the local value of Bell (2003); i.e. fitting to all the magenta points as well as the green point; green dotted line with 1σ uncertainty region shaded, and anchoring to the local value of Bell (2003) by fitting to the function 2.64(1 + z)x where x is the free parameter (blue dot-dashed line). Also shown is the median in each redshift bin calculated using only directly-measured values (i.e. without applying a survival analysis; cyan squares), and the associated fit (solid cyan line).
Current usage metrics show cumulative count of Article Views (full-text article views including HTML views, PDF and ePub downloads, according to the available data) and Abstracts Views on Vision4Press platform.
Data correspond to usage on the plateform after 2015. The current usage metrics is available 48-96 hours after online publication and is updated daily on week days.
Initial download of the metrics may take a while.