Fig. 13
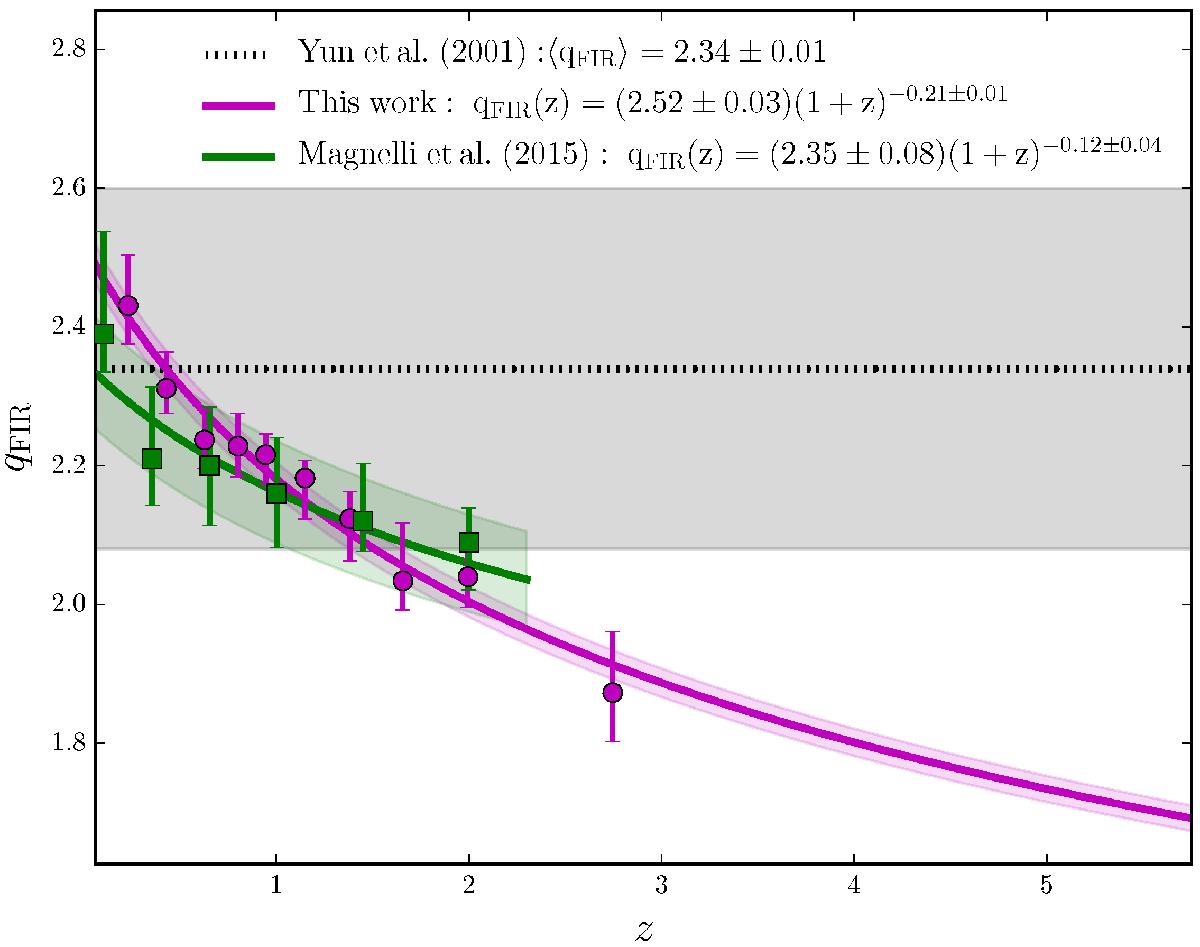
FIR-radio correlation (qFIR) versus redshift for star-forming galaxies. The evolving fit generated via a survival analysis in this work, assuming α = − 0.8 for objects not detected at 1.4 GHz, is shown by the magenta line. The evolution found by Magnelli et al. (2015) using a stacking analysis is shown by the green points and curve. The shaded magenta and green regions show the 1σ uncertainty. The local value of Yun et al. (2001; 2.34 ± 0.01) and associated spread (0.26) are shown by the dashed line and grey shaded area, respectively.
Current usage metrics show cumulative count of Article Views (full-text article views including HTML views, PDF and ePub downloads, according to the available data) and Abstracts Views on Vision4Press platform.
Data correspond to usage on the plateform after 2015. The current usage metrics is available 48-96 hours after online publication and is updated daily on week days.
Initial download of the metrics may take a while.