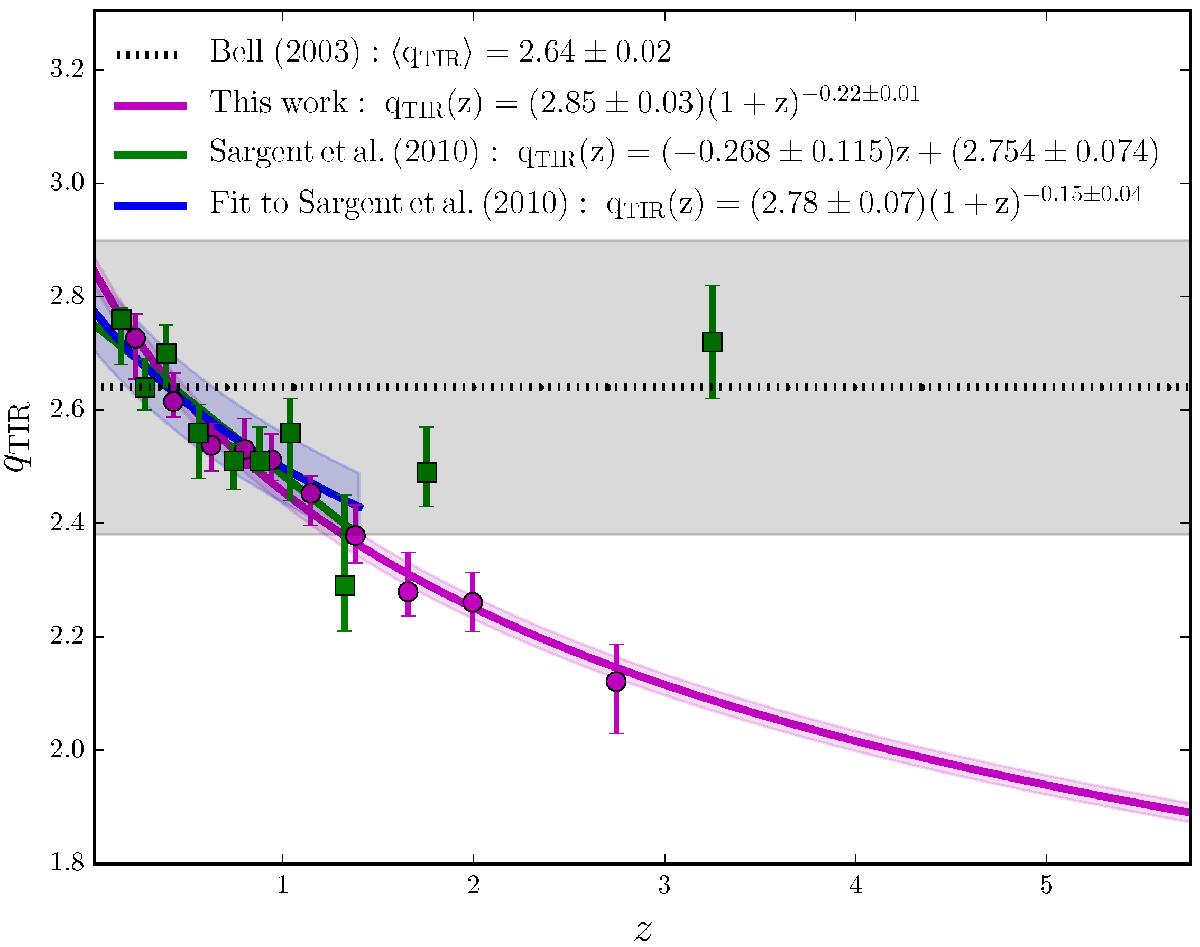
Fig. 12

Evolution of qTIR in comparison with the results of Sargent et al. (2010). The magenta points and fit show the results from this work using a full survival analysis, as in Fig. 9, however a spectral index of α = − 0.8 has now been assumed for objects not detected at 1.4 GHz. The measurements of Sargent et al. (2010) and their linear fit are shown by the green points and line. A power-law evolution to the individual measurements of Sargent et al. (2010) is shown by the blue line, for ease of comparison. The shaded magenta and blue regions show the 1σ uncertainty regions calculated by propagating the errors on the corresponding fitting parameters. The local measurement and spread (grey shading) of Bell (2003) are also shown.
Current usage metrics show cumulative count of Article Views (full-text article views including HTML views, PDF and ePub downloads, according to the available data) and Abstracts Views on Vision4Press platform.
Data correspond to usage on the plateform after 2015. The current usage metrics is available 48-96 hours after online publication and is updated daily on week days.
Initial download of the metrics may take a while.


