Fig. 10
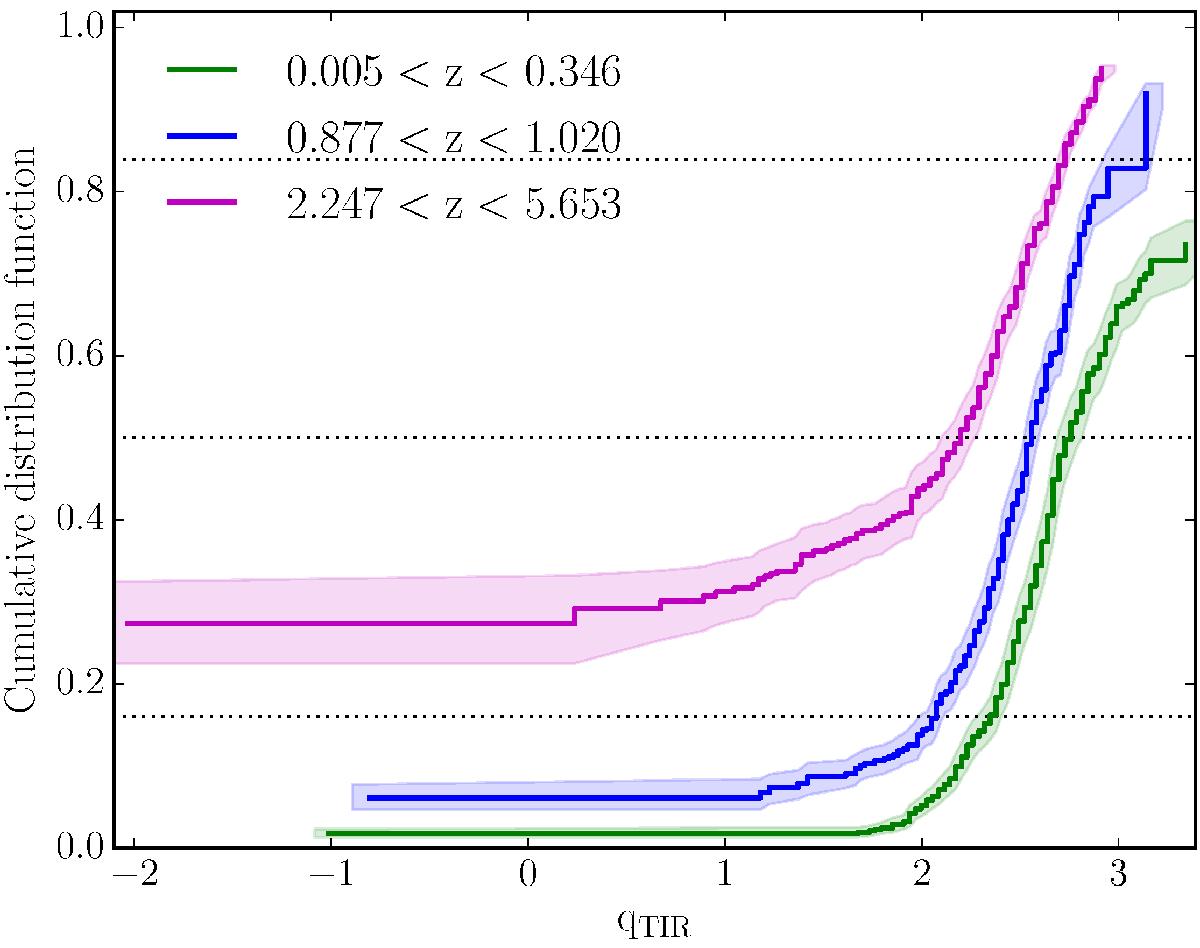
Cumulative distribution functions produced via the doubly-censored survival analysis within the first, fifth and tenth redshift bins. The plots show the fraction of data with qTIR values less than the value indicated on the lower axis. Shaded regions indicate the 95% confidence interval. The 16th, 50th and 84th percentiles are indicated by the bottom, middle and top dotted lines, respectively.
Current usage metrics show cumulative count of Article Views (full-text article views including HTML views, PDF and ePub downloads, according to the available data) and Abstracts Views on Vision4Press platform.
Data correspond to usage on the plateform after 2015. The current usage metrics is available 48-96 hours after online publication and is updated daily on week days.
Initial download of the metrics may take a while.