Fig. 1
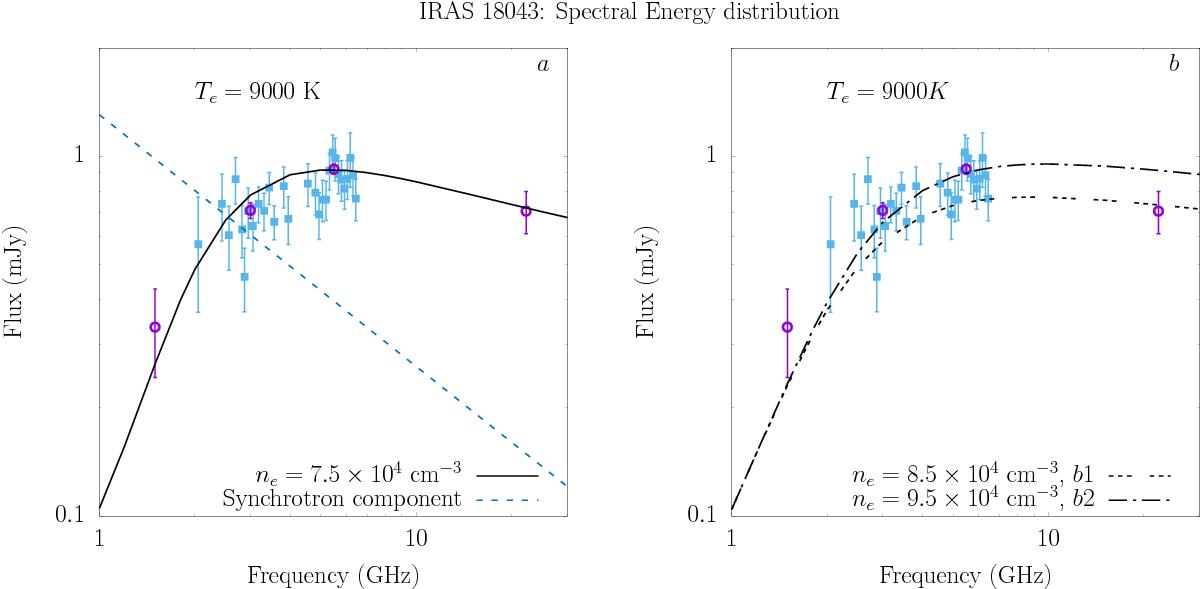
Spectral energy distribution measured toward the WF IRAS 18043−2116. The small filled squares are the measurements at individual spectral windows within JVLA frequency bands C and S. The open circles represent the fluxes obtained from mfs evaluated at the central frequency of JVLA bands L, S, and C. The flux at 22 GHz was measured in 2013 with ATCA. The different lines in the panels represent the fit to the data points obtained from radiative transfer of radio continuum emission (see text). In panel a) the model includes thermal and nonthermal components, assuming the latter is synchrotron radiation with flux at 22 GHz of 0.15 mJy and spectral index =− 0.7 (dashed line). At low frequencies the synchrotron component is mostly absorbed by optically thick free-free emission and does not contribute to the total emission. In panel b), the models only consider thermal emission. Model b1 fits the flux at 22 GHz measured with ATCA in 2013, whereas Model b2 fits the fluxes measured with JVLA in 2015. The difference between the two thermal models suggests an increase in the 22 GHz flux density of ≈20% between 2013 and 2015.
Current usage metrics show cumulative count of Article Views (full-text article views including HTML views, PDF and ePub downloads, according to the available data) and Abstracts Views on Vision4Press platform.
Data correspond to usage on the plateform after 2015. The current usage metrics is available 48-96 hours after online publication and is updated daily on week days.
Initial download of the metrics may take a while.