Fig. 7
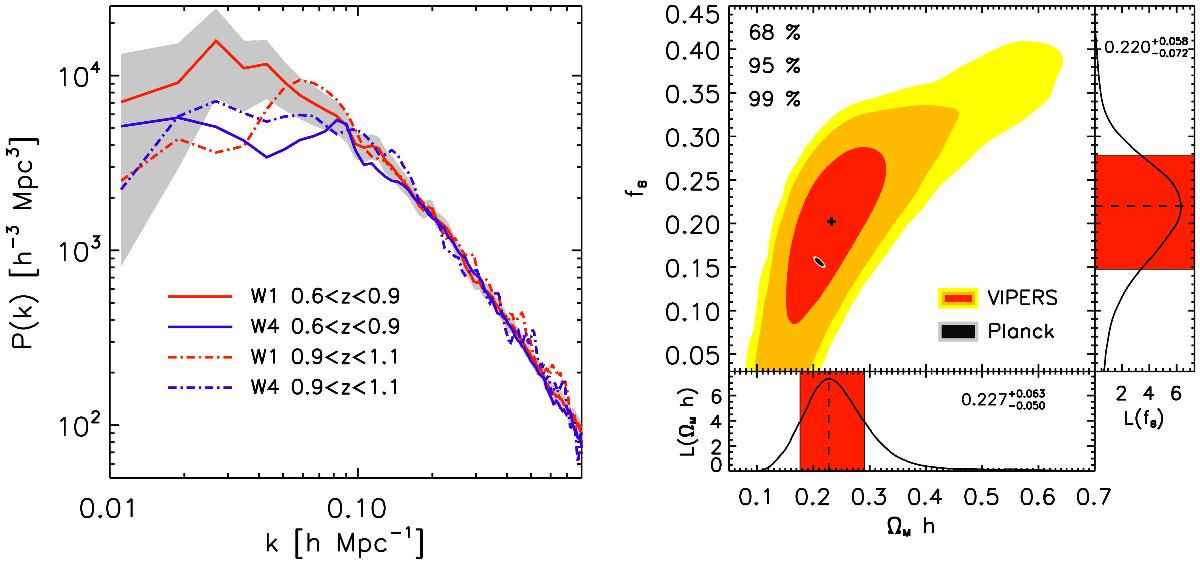
Left: estimates of the monopole of the redshift-space power spectrum from the four independent VIPERS subsamples in W1 and W4 and two redshift bins. The shaded area gives the diagonal error corridor around the 0.6 <z < 0.9 W1 sample, as provided by the dispersion of the corresponding mock catalogues. Right: corresponding likelihood surfaces for the simultaneous fit to the four power spectra. The contours correspond to two-parameter confidence levels of 68, 95 and 99 per cent. The measurements have been used down to scales corresponding to kmax = 0.40 h Mpc-1 and we have marginalised over the galaxy bias and velocity dispersion.
Current usage metrics show cumulative count of Article Views (full-text article views including HTML views, PDF and ePub downloads, according to the available data) and Abstracts Views on Vision4Press platform.
Data correspond to usage on the plateform after 2015. The current usage metrics is available 48-96 hours after online publication and is updated daily on week days.
Initial download of the metrics may take a while.