Fig. 4
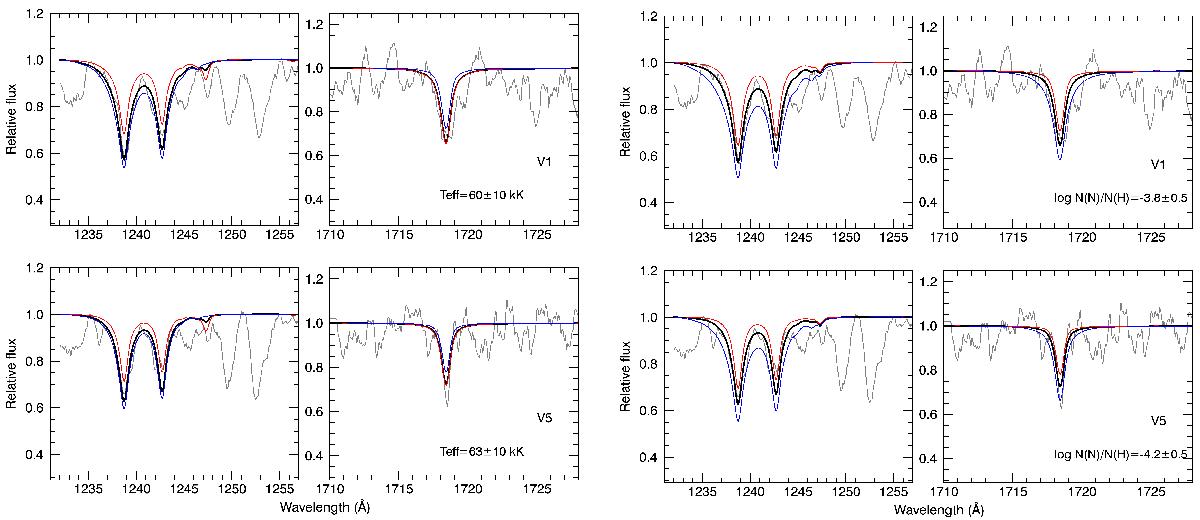
Best fitting models (thick black line) for the N v doublet and N iv line in the spectrum of V1 (upper panels) and V5 (lower panels). The observed spectra (grey) are smoothed over a six pixels width (one resolution element) in this figure and the following ones. Right panels: as a comparison, model spectra with a lower (red) and higher (blue) temperature are shown. Left panels: with model spectra having a lower (red) and higher (blue) nitrogen abundance.
Current usage metrics show cumulative count of Article Views (full-text article views including HTML views, PDF and ePub downloads, according to the available data) and Abstracts Views on Vision4Press platform.
Data correspond to usage on the plateform after 2015. The current usage metrics is available 48-96 hours after online publication and is updated daily on week days.
Initial download of the metrics may take a while.