Free Access
Fig. 2
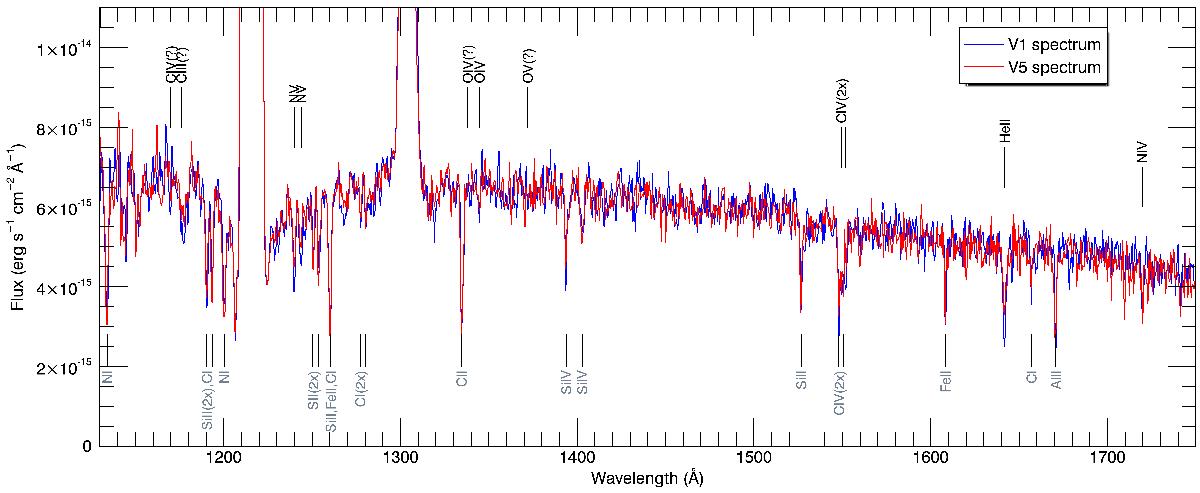
COS spectra of V1 and V5 (binned over six pixels for more clarity), the flux from V5 was adjusted so that the two spectra overlap. The strongest interstellar lines are indicated below the spectra while the photospheric ones are labelled above.
Current usage metrics show cumulative count of Article Views (full-text article views including HTML views, PDF and ePub downloads, according to the available data) and Abstracts Views on Vision4Press platform.
Data correspond to usage on the plateform after 2015. The current usage metrics is available 48-96 hours after online publication and is updated daily on week days.
Initial download of the metrics may take a while.