Fig. 31
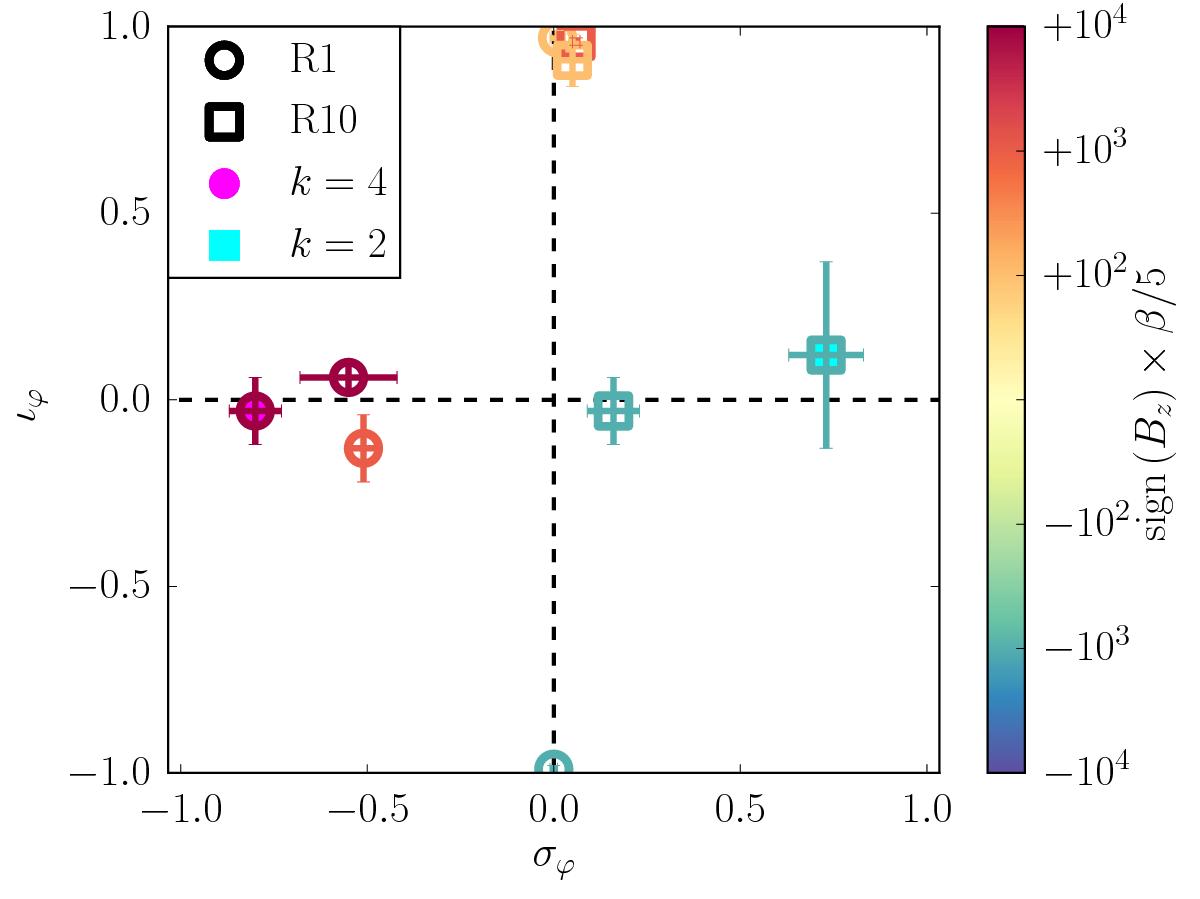
Symmetry coefficients σϕ and ιϕ in our set of 2D simulations, averaged over representative time intervals; colors indicate the initial midplane magnetization β, blue corresponding to Bz< 0; runs in [ 1,10 ] au are plotted with circles, runs in [ 10,100 ] au are plotted with squares; different background colors correspond to different disk-corona temperature contrast k; the error bars correspond to standard deviations over time.
Current usage metrics show cumulative count of Article Views (full-text article views including HTML views, PDF and ePub downloads, according to the available data) and Abstracts Views on Vision4Press platform.
Data correspond to usage on the plateform after 2015. The current usage metrics is available 48-96 hours after online publication and is updated daily on week days.
Initial download of the metrics may take a while.