Free Access
Fig. 12
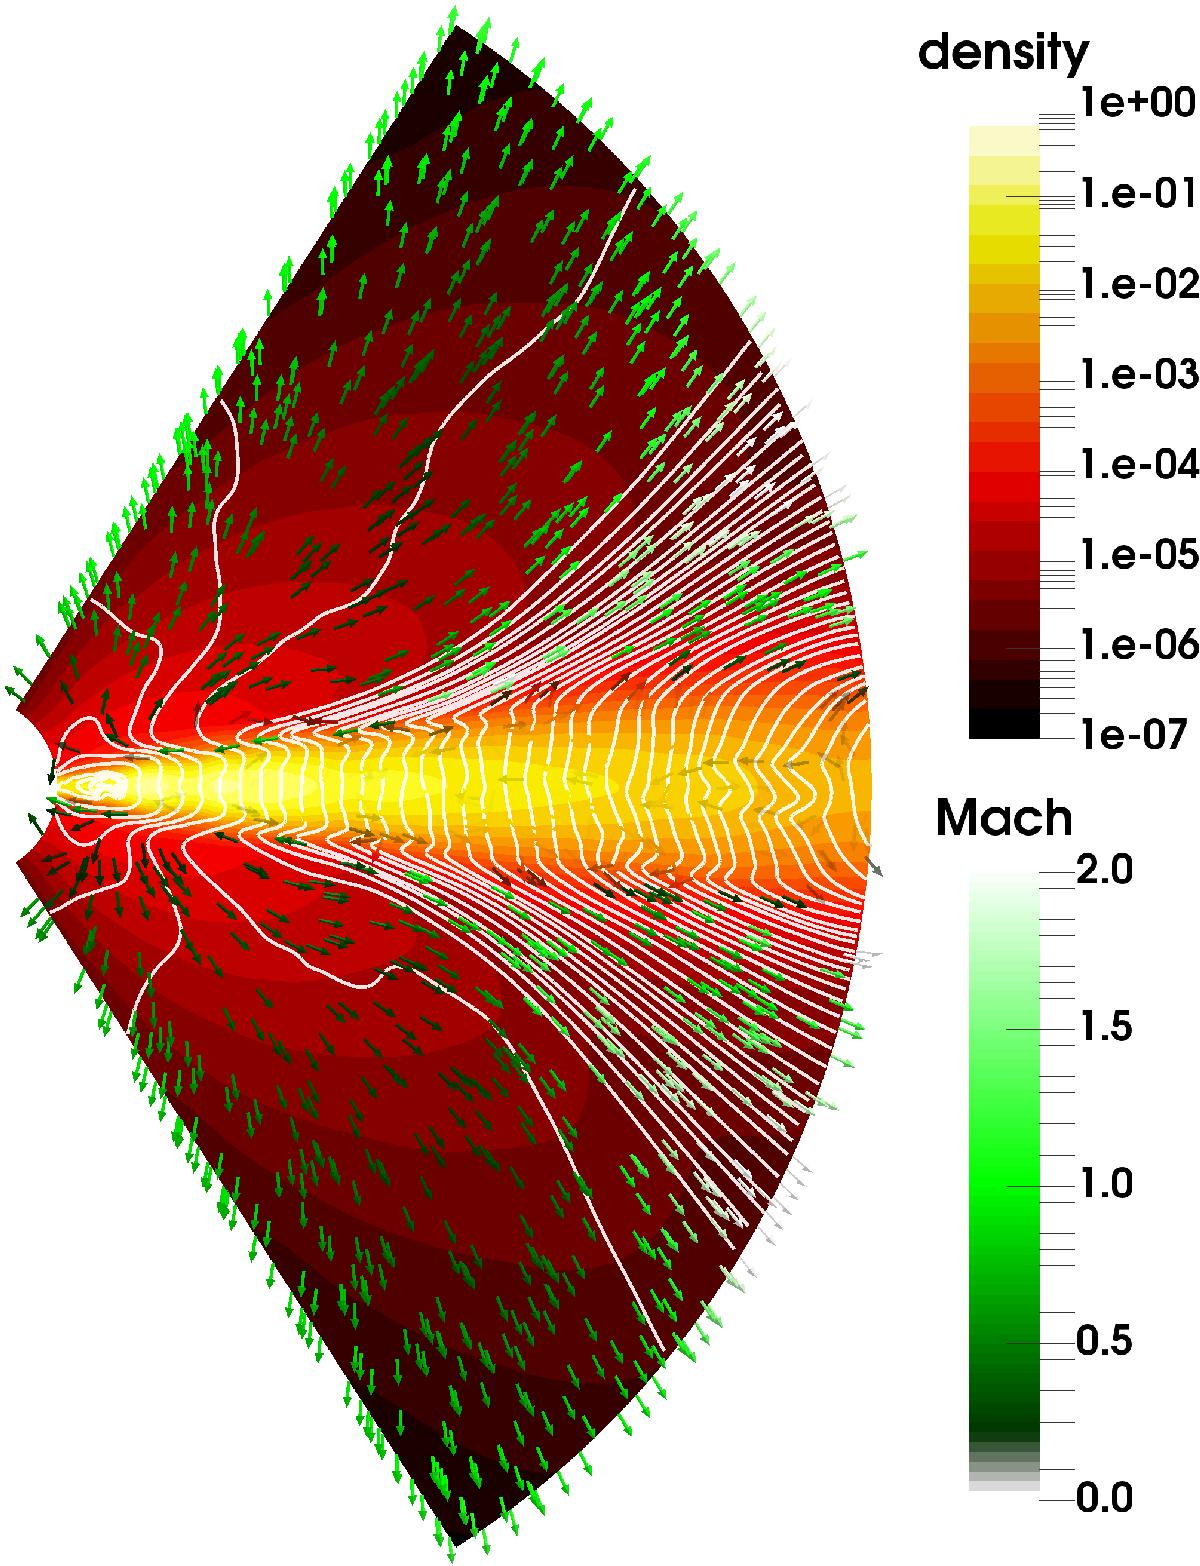
Averaged flow poloidal map for run R10-M3 (from 10 au to 100 au, with Bz< 0) from 400T0 to 700T0; magnetic field lines are regularly sampled along the midplane, and the velocity field is indicated with green arrows over the background density field.
Current usage metrics show cumulative count of Article Views (full-text article views including HTML views, PDF and ePub downloads, according to the available data) and Abstracts Views on Vision4Press platform.
Data correspond to usage on the plateform after 2015. The current usage metrics is available 48-96 hours after online publication and is updated daily on week days.
Initial download of the metrics may take a while.