Fig. 11
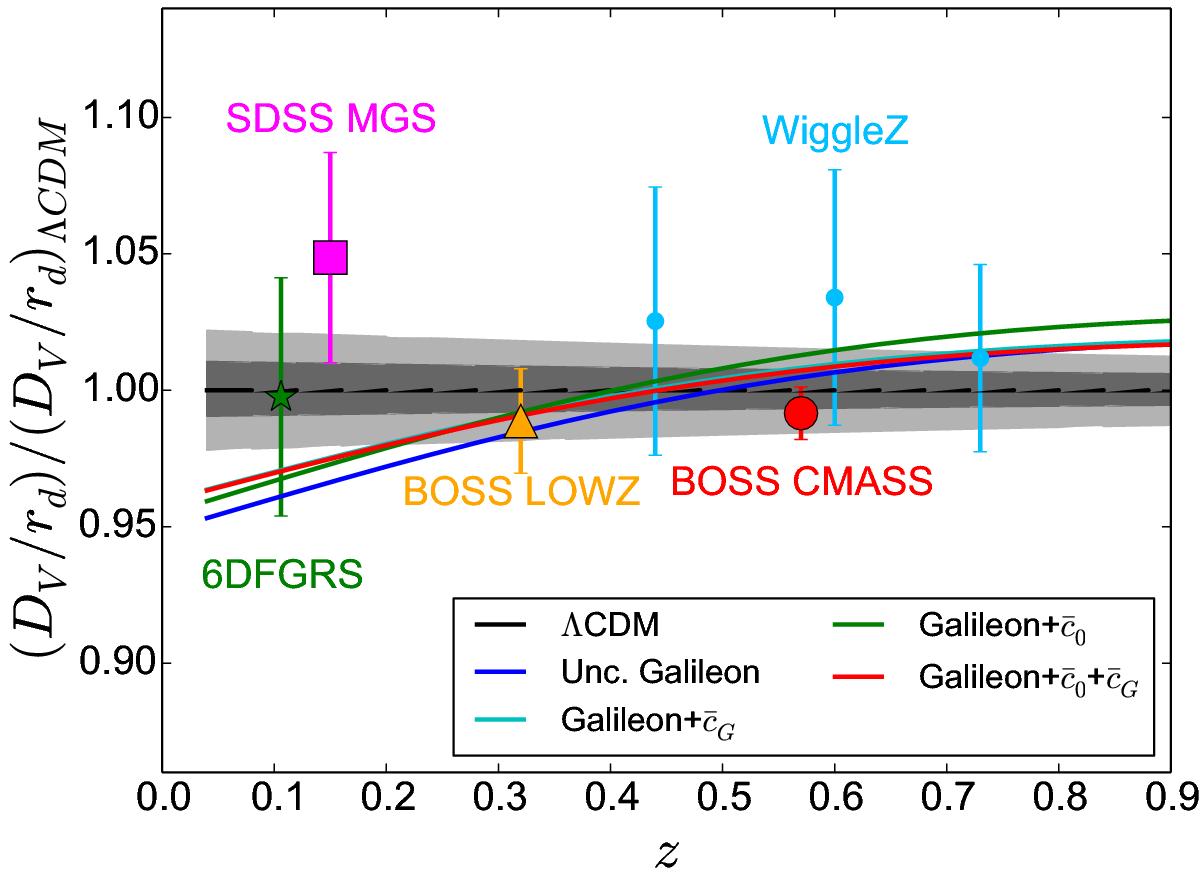
Comparison of the best fit Galileon and ΛCDM DV/rd predictions with data. The grey bands show the 68% and 95% confidence ranges allowed for the ΛCDM prediction using all data. The data points come from Table 3. BOSS CMASS DV/rd measurement from Anderson et al. (2014) is plotted for convenience, but is not used in the fitting procedure; the BOSS CMASS anistropic measurement is preferred.
Current usage metrics show cumulative count of Article Views (full-text article views including HTML views, PDF and ePub downloads, according to the available data) and Abstracts Views on Vision4Press platform.
Data correspond to usage on the plateform after 2015. The current usage metrics is available 48-96 hours after online publication and is updated daily on week days.
Initial download of the metrics may take a while.