Fig. 6
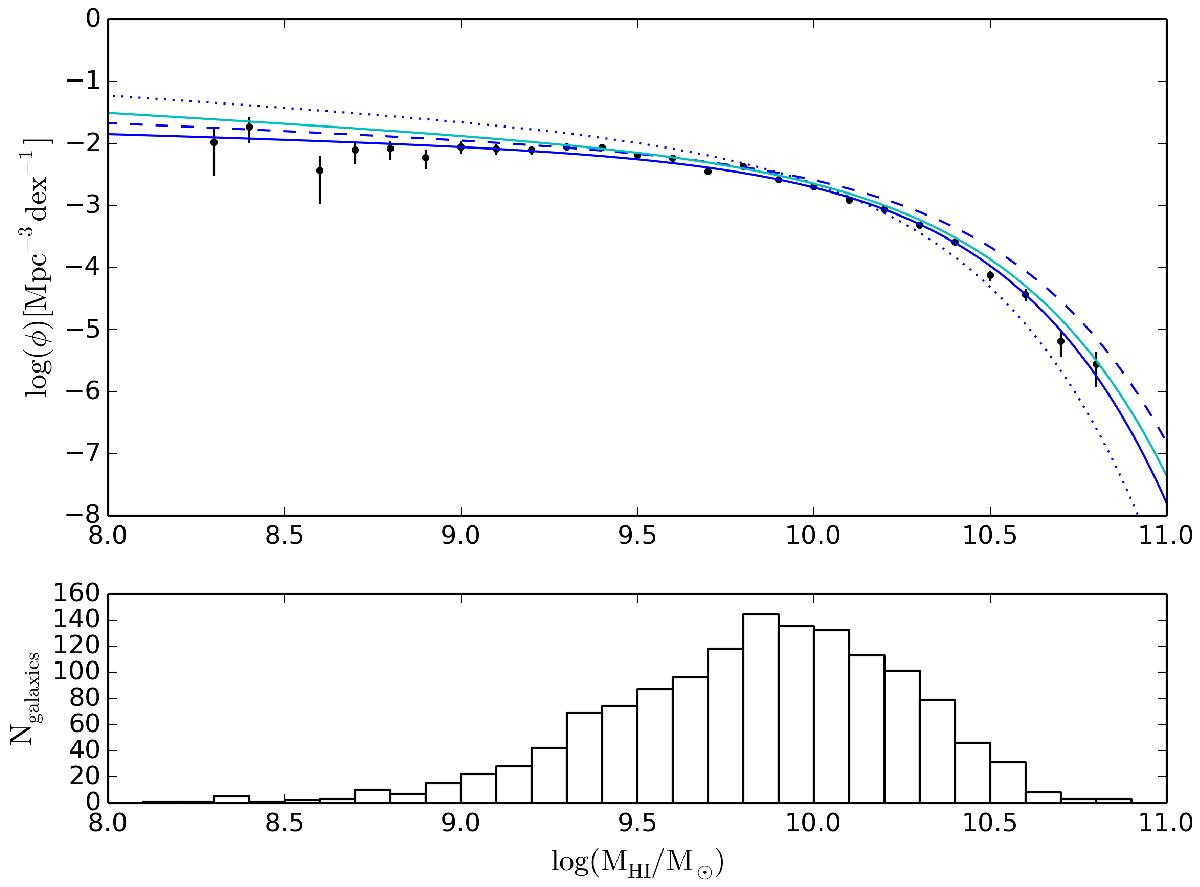
HI mass function from KLUN (dark blue line) vs. Springob et al. (2005) (blue dashed line), Zwaan et al. (2005) (blue dotted line), and Haynes et al. (2011) (cyan line). KLUN and Springob results are both normalized to the ALFALFA survey. Observed values (black dots) are calculated per bins of 0.1 in log (MHI/M⊙) with error bars from the Poisson law, and the corresponding population is shown as a histogram in the bottom panel.
Current usage metrics show cumulative count of Article Views (full-text article views including HTML views, PDF and ePub downloads, according to the available data) and Abstracts Views on Vision4Press platform.
Data correspond to usage on the plateform after 2015. The current usage metrics is available 48-96 hours after online publication and is updated daily on week days.
Initial download of the metrics may take a while.