Free Access
Fig. 5
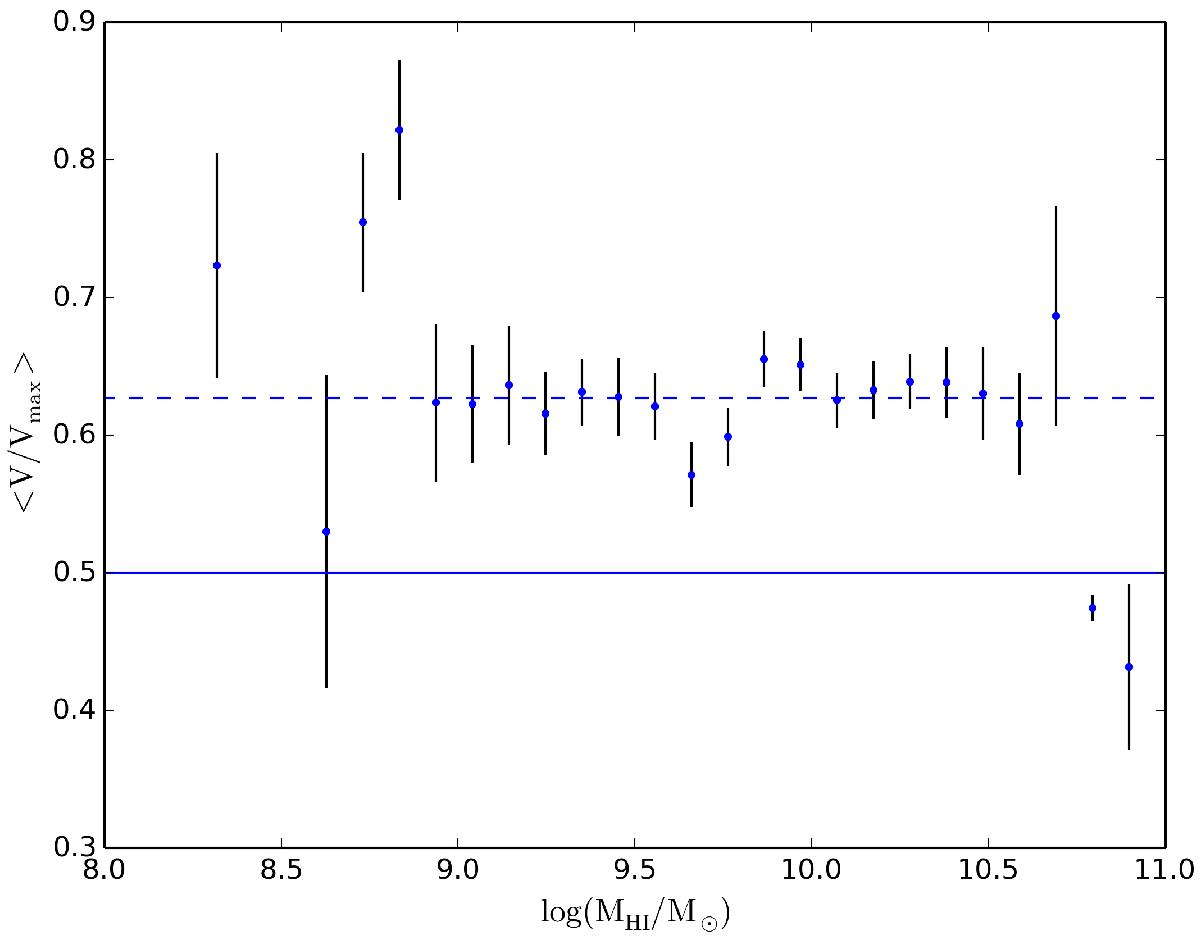
Mean value ⟨ V/Vmax ⟩ binned by HI mass. Error bars are Poisson counting uncertainties. The solid line indicates the value of 0.5 expected for a homogeneous spatial distribution. The dashed line shows the actual average value from the KLUN catalog limited to log (FHI) ≥ 0.7.
Current usage metrics show cumulative count of Article Views (full-text article views including HTML views, PDF and ePub downloads, according to the available data) and Abstracts Views on Vision4Press platform.
Data correspond to usage on the plateform after 2015. The current usage metrics is available 48-96 hours after online publication and is updated daily on week days.
Initial download of the metrics may take a while.