Fig. 9
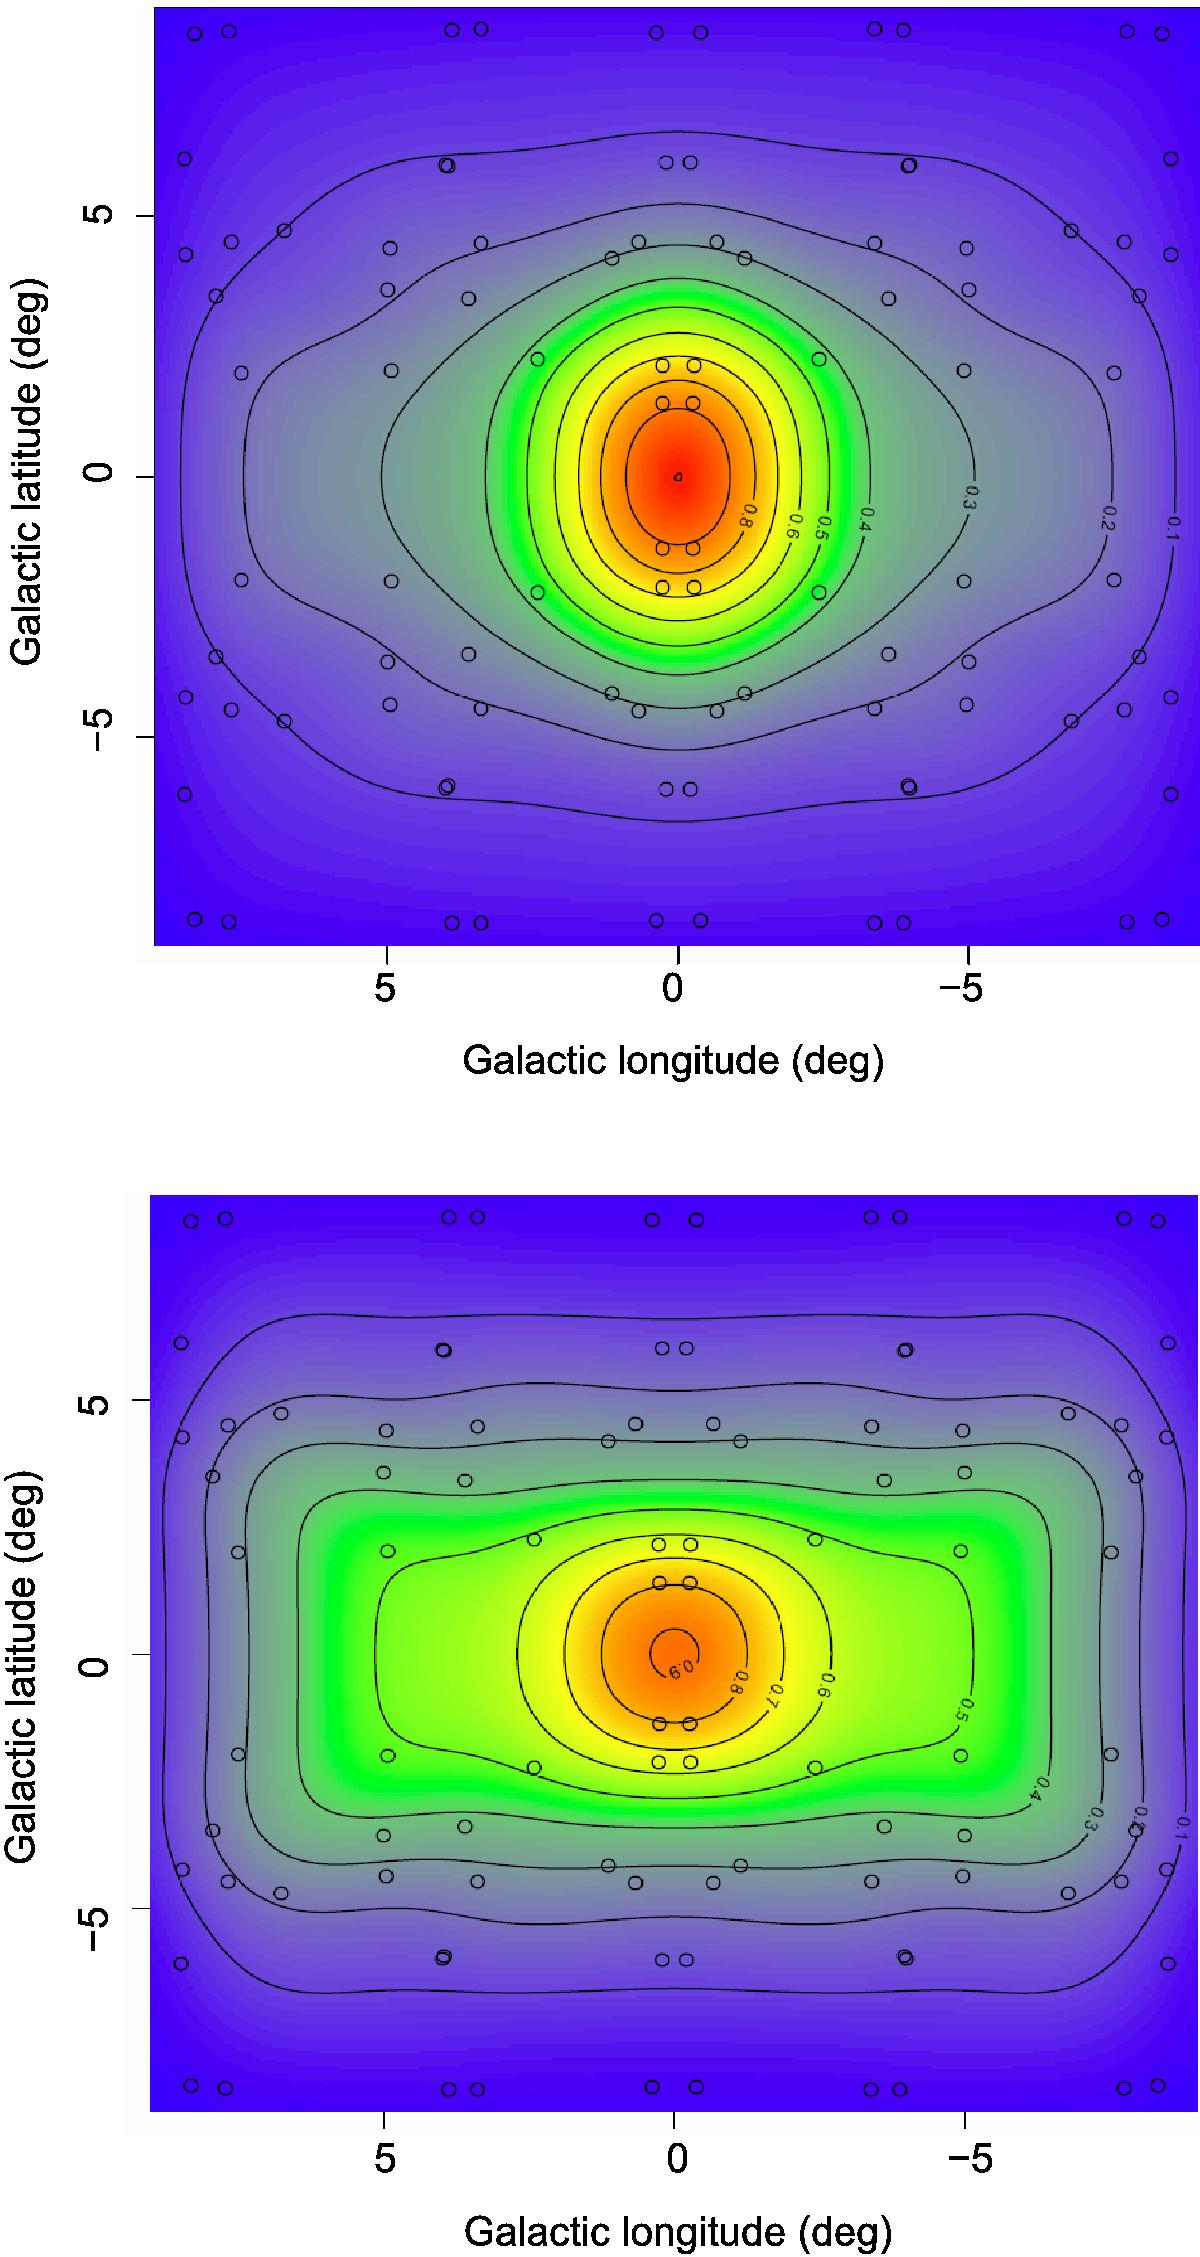
Density map of metal poor (top) and metal rich (bottom) RC stars obtained using the two component MDF in each field and the total number of RC stars from Valenti et al. (2016). Open circles show the grid of fields used in the interpolation, resulting from folding the original map of GIBS fields with respect to both Galactic latitude and longitude. The number of RC stars of each component was normalized by the maximum number of RC stars in the metal poor map so they are color-coded to the same scale between values of 0 and 1. Contours are over-plotted in both maps and correspond to differences of 0.1 in the normalized RC star counts.
Current usage metrics show cumulative count of Article Views (full-text article views including HTML views, PDF and ePub downloads, according to the available data) and Abstracts Views on Vision4Press platform.
Data correspond to usage on the plateform after 2015. The current usage metrics is available 48-96 hours after online publication and is updated daily on week days.
Initial download of the metrics may take a while.