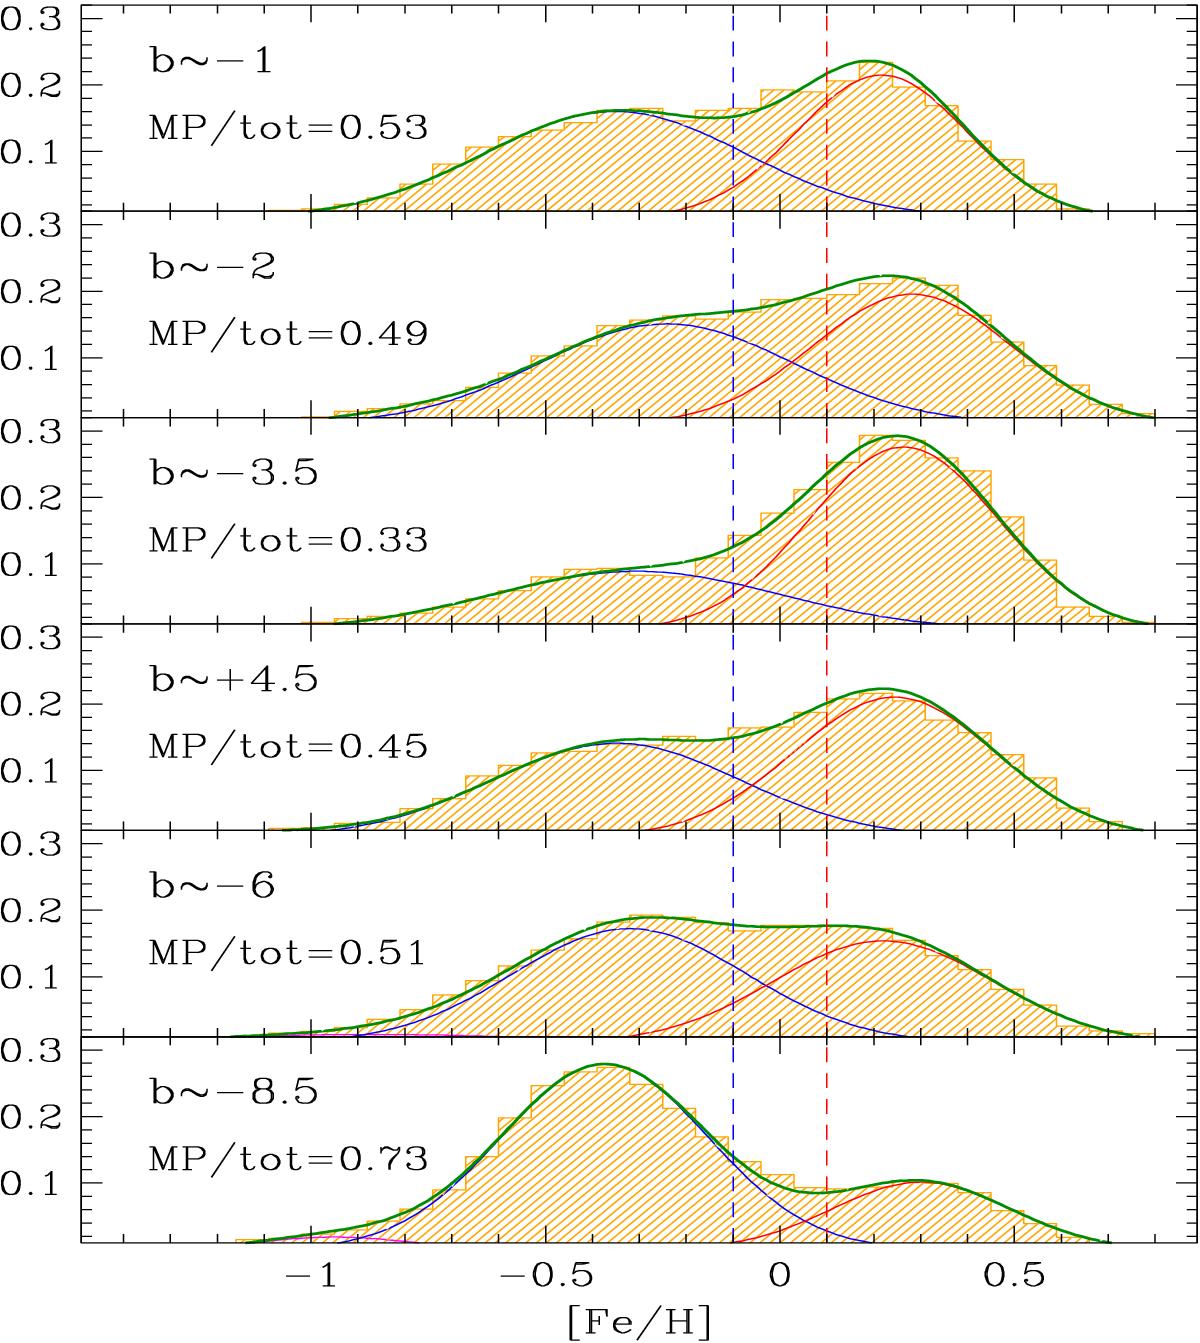
Fig. 7

MDFs of all the stars at constant latitudes, where fields at different longitudes have been combined. The fraction of metal poor stars compared to the total is listed in each panel. As discussed in the text, the fraction of metal poor stars decreases from b = −8.5 to b = −3.5, where it reaches a minimum, but then rises again at latitude closer to the Galactic plane. The vertical dashed lines mark the limits of the metal poor and metal rich populations (see text).
Current usage metrics show cumulative count of Article Views (full-text article views including HTML views, PDF and ePub downloads, according to the available data) and Abstracts Views on Vision4Press platform.
Data correspond to usage on the plateform after 2015. The current usage metrics is available 48-96 hours after online publication and is updated daily on week days.
Initial download of the metrics may take a while.


