Fig. 3
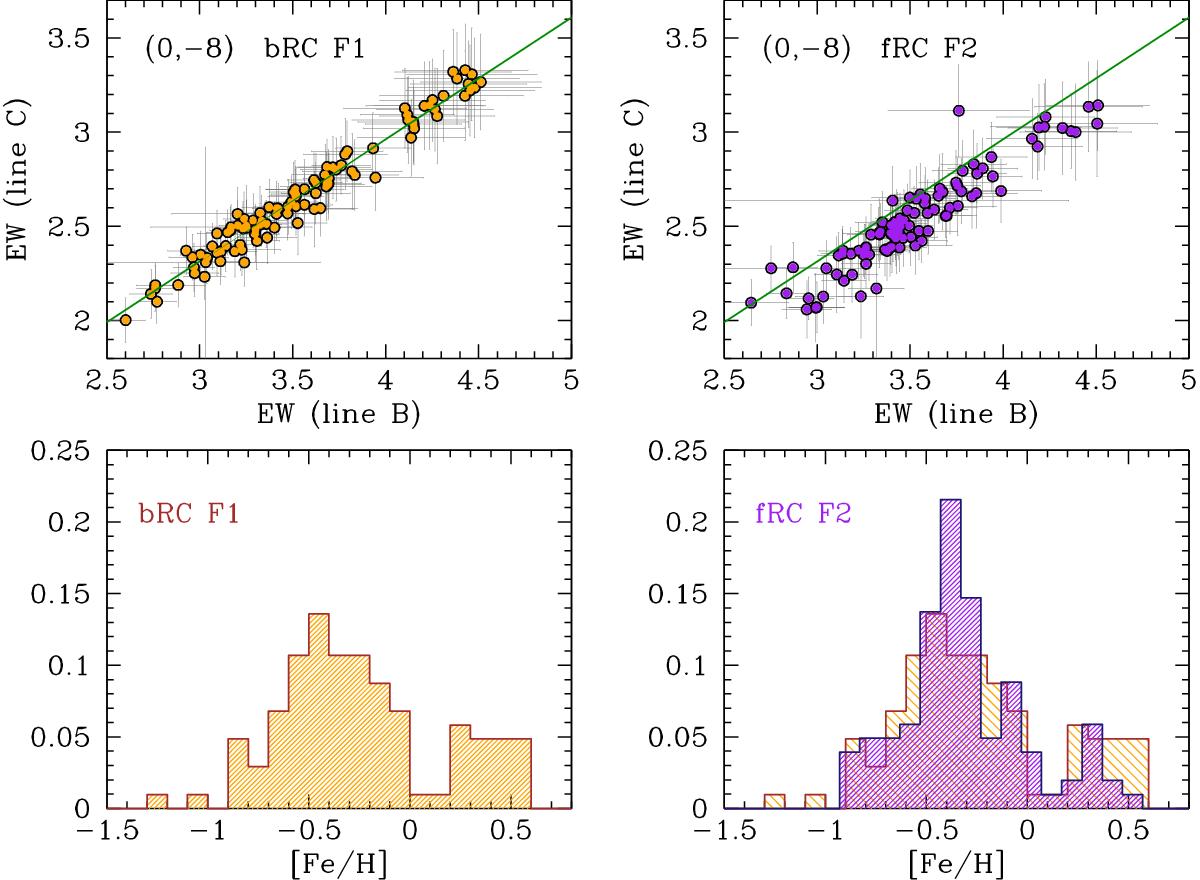
Top panels: trend of the EW of line C versus line B for two different fiber allocations in the field at (0,−8). The orange points are 103 targets in the bright RC, while the purple ones are 102 targets in the faint RC. The green line is the same trend for the RC stars in Baade’s Window used to derive the CaT vs. [Fe/H] calibration. While the orange targets beautifully follow the expected ratio, the purple points have an offset, that might be due either to an overestimation of line B and/or to an underestimation of line C. Bottom panels: (left) MDF derived from the 103 targets with good line ratio; (right) the MDF derived from the targets with offset line ratio, in purple, is compared with the orange one, obtained from targets with good line ratio.
Current usage metrics show cumulative count of Article Views (full-text article views including HTML views, PDF and ePub downloads, according to the available data) and Abstracts Views on Vision4Press platform.
Data correspond to usage on the plateform after 2015. The current usage metrics is available 48-96 hours after online publication and is updated daily on week days.
Initial download of the metrics may take a while.