Fig. 12
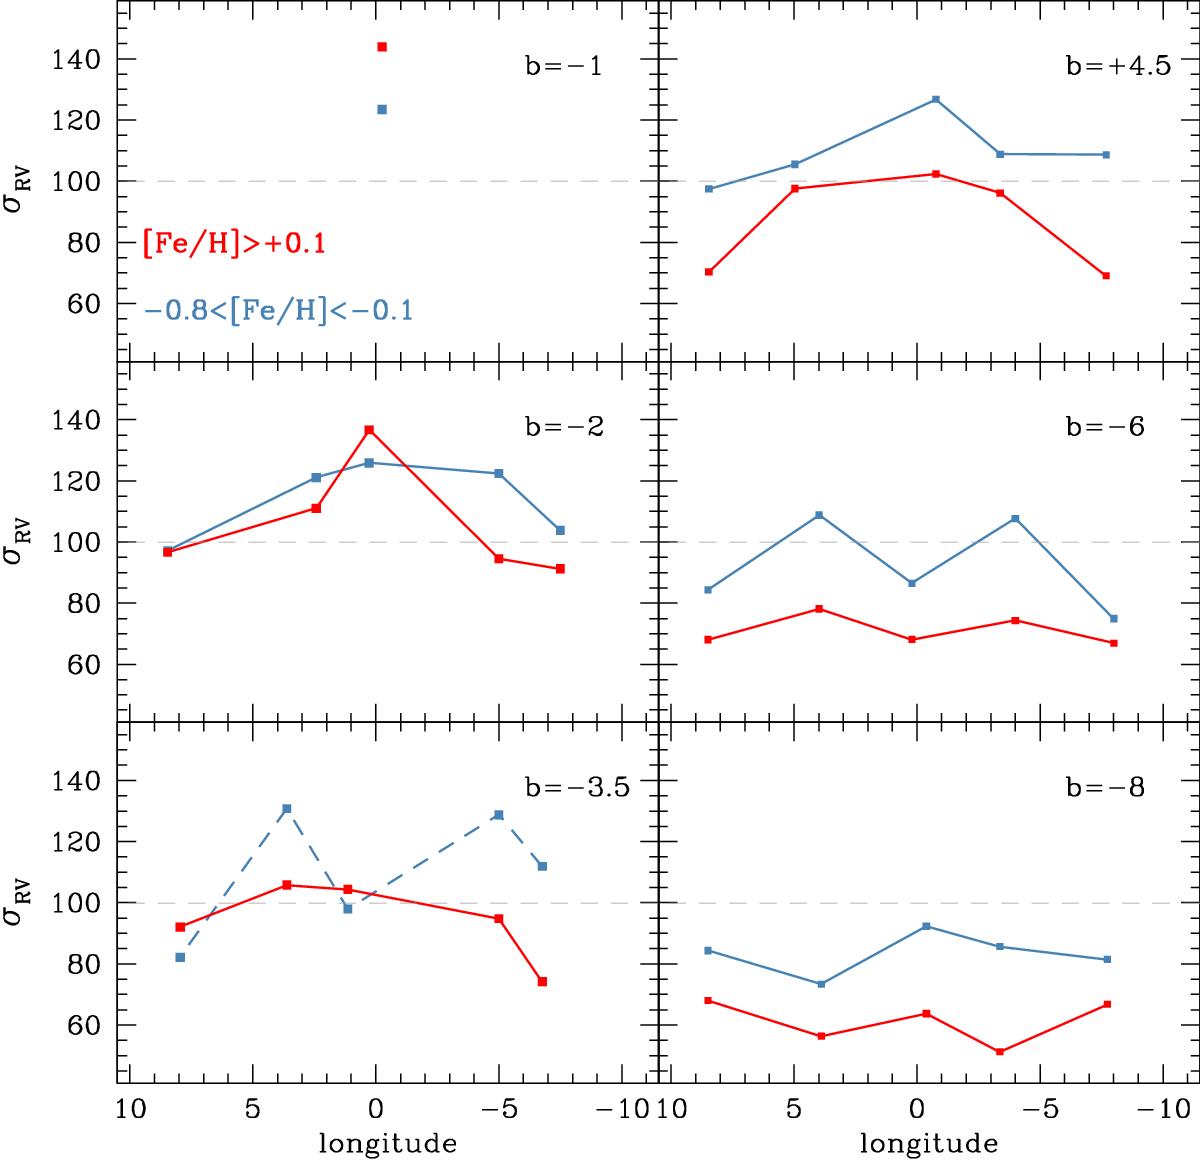
The trend of velocity dispersion with longitude, in six strips of constant latitude. The horizontal dashed line at σRV = 100 has been drawn to guide the eye. Notice that, in the outer bulge, |b| > 3.5, the metal poor component has a higher velocity dispersion compared to the metal rich one. However, at b = −2,σRV is roughly equal for both metallicity bins, while at b = −1 the σRV for the metal poor sample lies below that of the metal rich population. Notice that the metal poor component at b = −3.5 contains very few stars, for this reason the trend is noisy (dashed line).
Current usage metrics show cumulative count of Article Views (full-text article views including HTML views, PDF and ePub downloads, according to the available data) and Abstracts Views on Vision4Press platform.
Data correspond to usage on the plateform after 2015. The current usage metrics is available 48-96 hours after online publication and is updated daily on week days.
Initial download of the metrics may take a while.