Free Access
Fig. 6
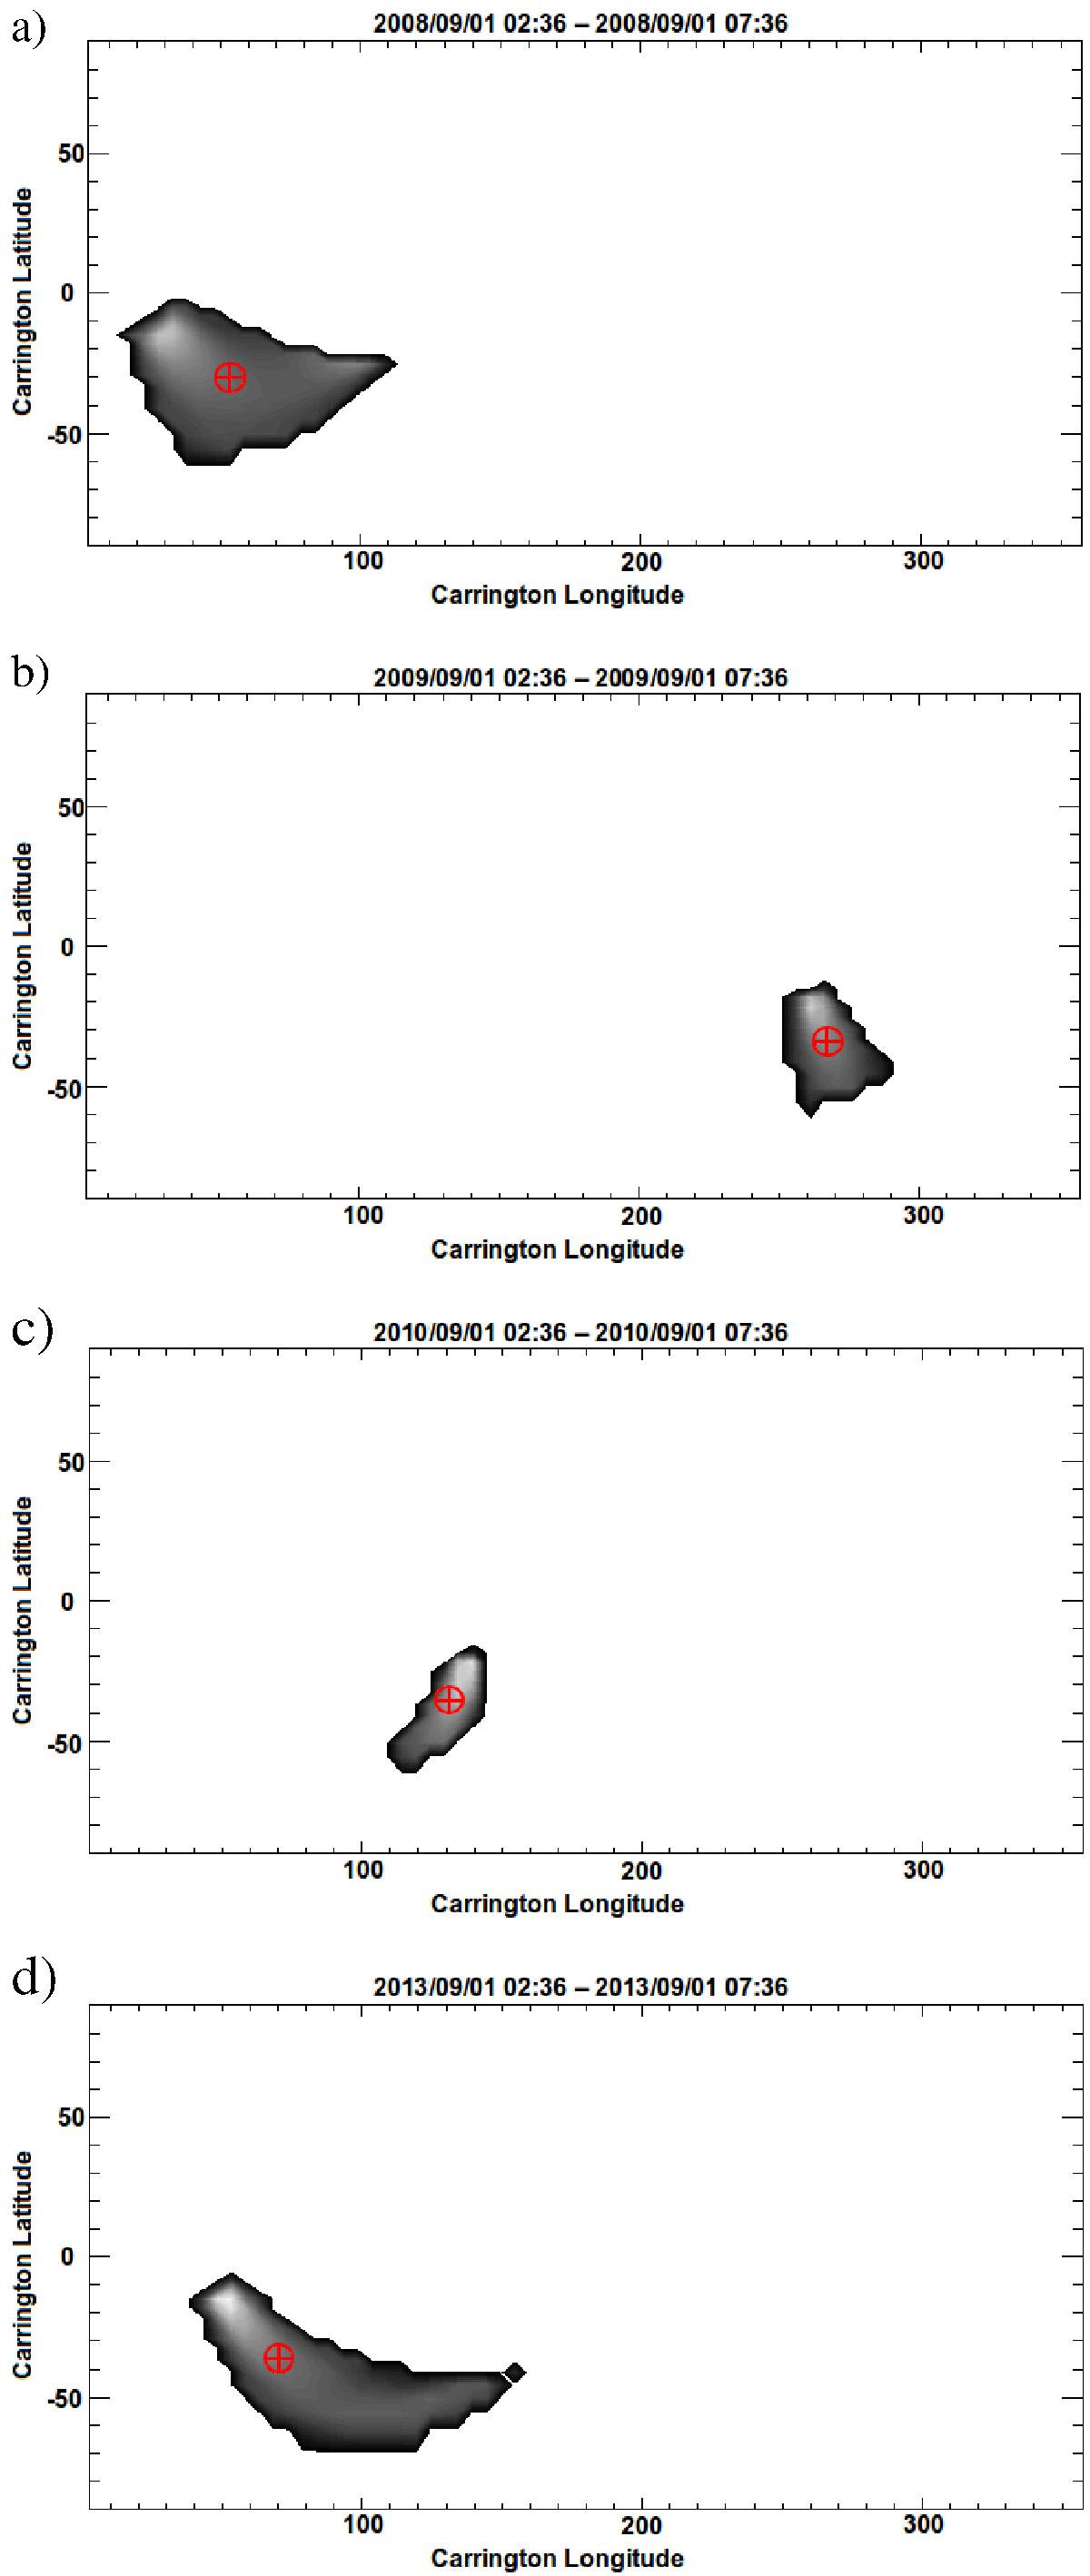
Maps in Carrington coordinates of the detected regions through which identical CMEs passed, but having been modelled for the changes in observer separation from the years 2008, 2009, 2010 and 2013 (a)–d)), respectively). Cross-hairs represent the location of the centroid.
Current usage metrics show cumulative count of Article Views (full-text article views including HTML views, PDF and ePub downloads, according to the available data) and Abstracts Views on Vision4Press platform.
Data correspond to usage on the plateform after 2015. The current usage metrics is available 48-96 hours after online publication and is updated daily on week days.
Initial download of the metrics may take a while.