Free Access
Fig. 5
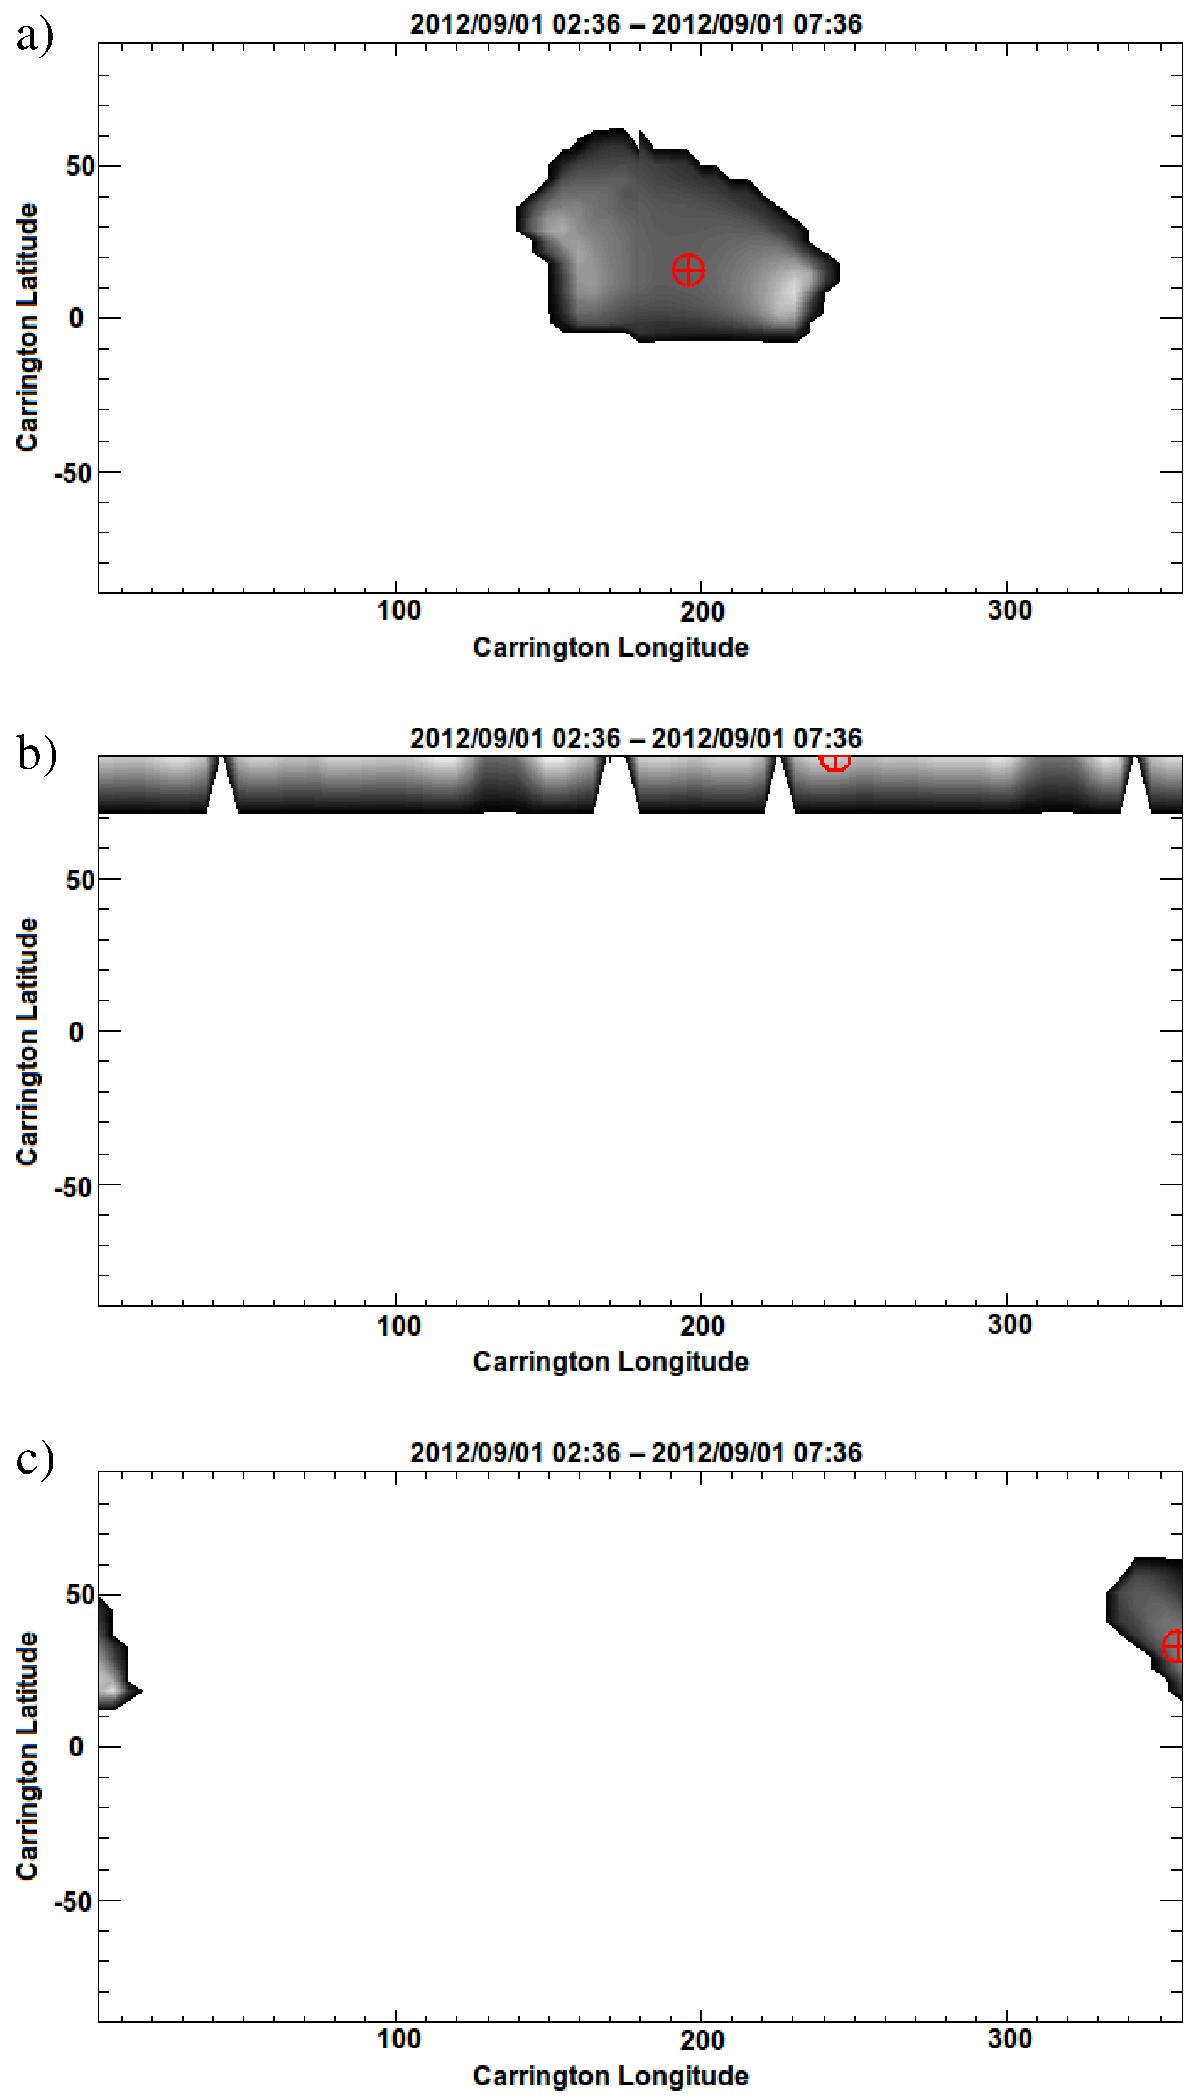
Maps of the detected regions through which a CME passed in Carrington coordinates. a) Example event corresponding to Fig. 4. b) CME erupting at a high latitude. c) CME that erupted from close to 0° Carrington longitude. Cross-hairs represent the detected centroid.
Current usage metrics show cumulative count of Article Views (full-text article views including HTML views, PDF and ePub downloads, according to the available data) and Abstracts Views on Vision4Press platform.
Data correspond to usage on the plateform after 2015. The current usage metrics is available 48-96 hours after online publication and is updated daily on week days.
Initial download of the metrics may take a while.