Free Access
Fig. 12
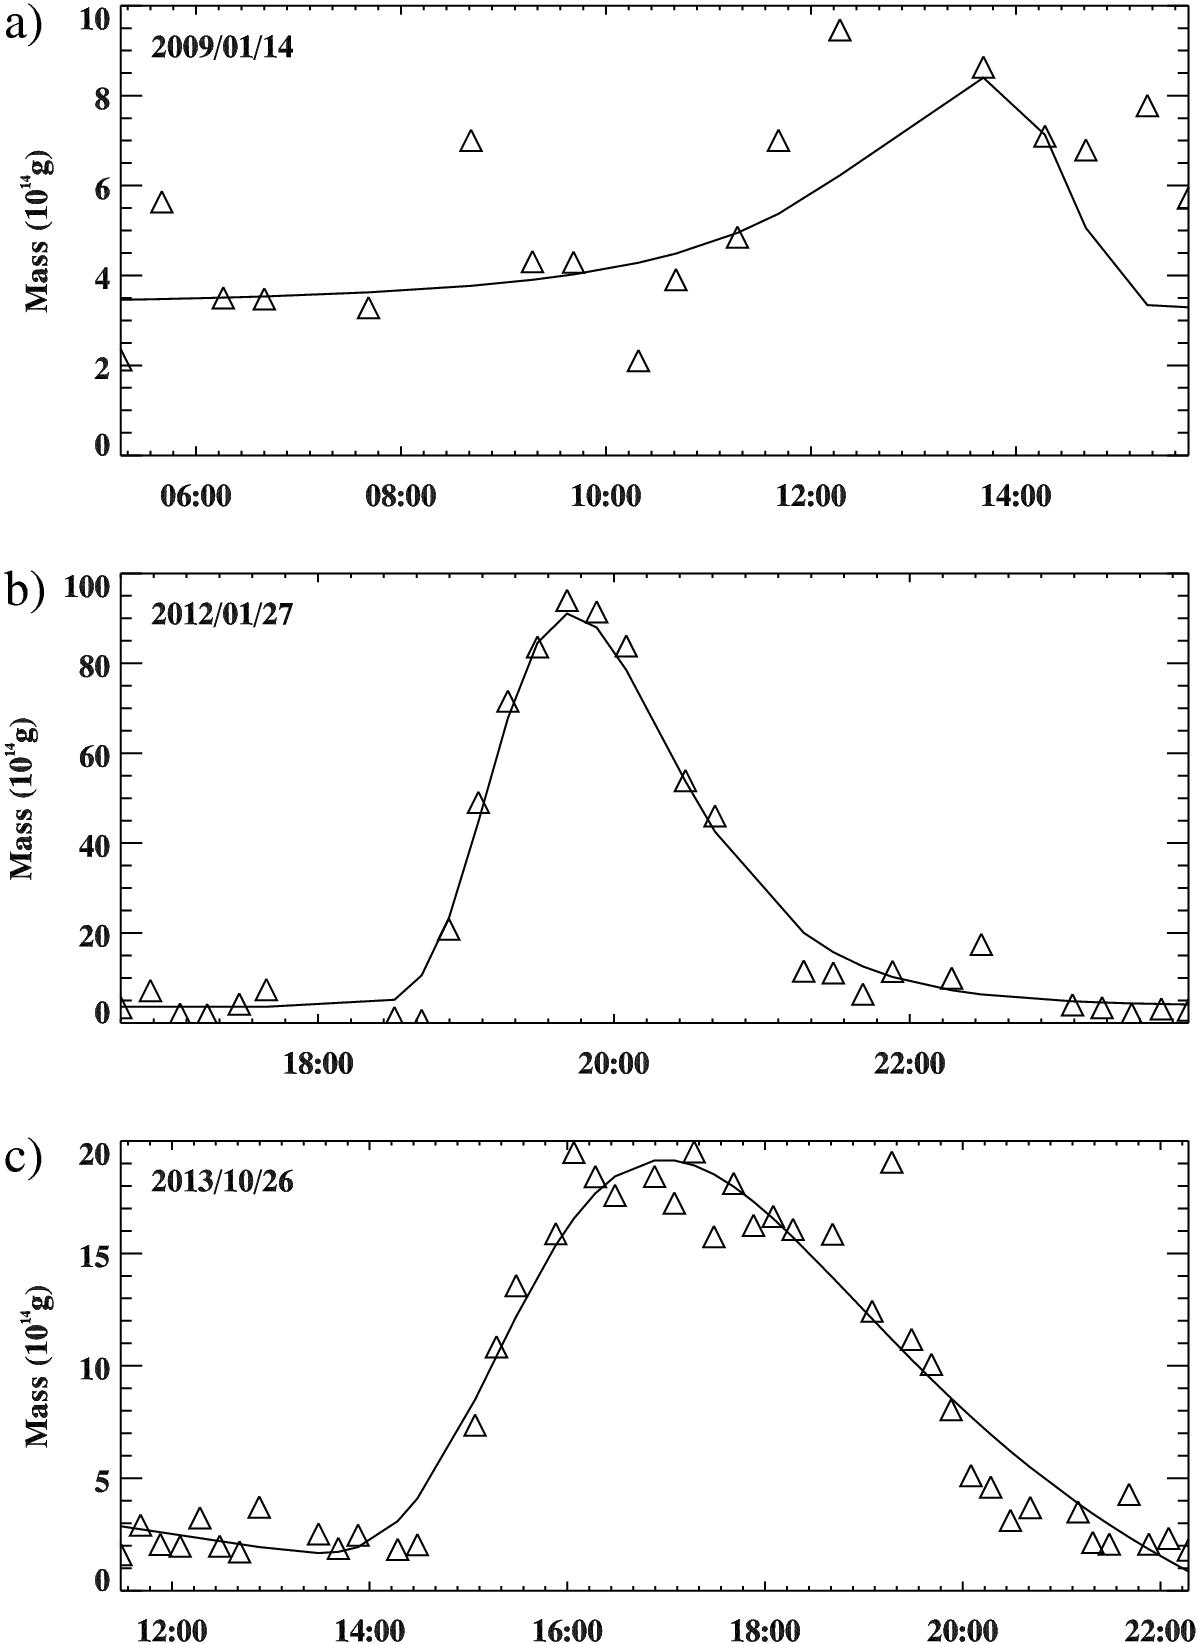
Estimates of mass as a function of time for the CMEs of a) 14/01/2009; b) 27/01/2012; and c) 26/10/2013. The symbols show each estimate for a time series of LASCO C3 observations, whilst the solid line shows a fitted skewed Gaussian plus linear background, as described in the text.
Current usage metrics show cumulative count of Article Views (full-text article views including HTML views, PDF and ePub downloads, according to the available data) and Abstracts Views on Vision4Press platform.
Data correspond to usage on the plateform after 2015. The current usage metrics is available 48-96 hours after online publication and is updated daily on week days.
Initial download of the metrics may take a while.