Fig. 10
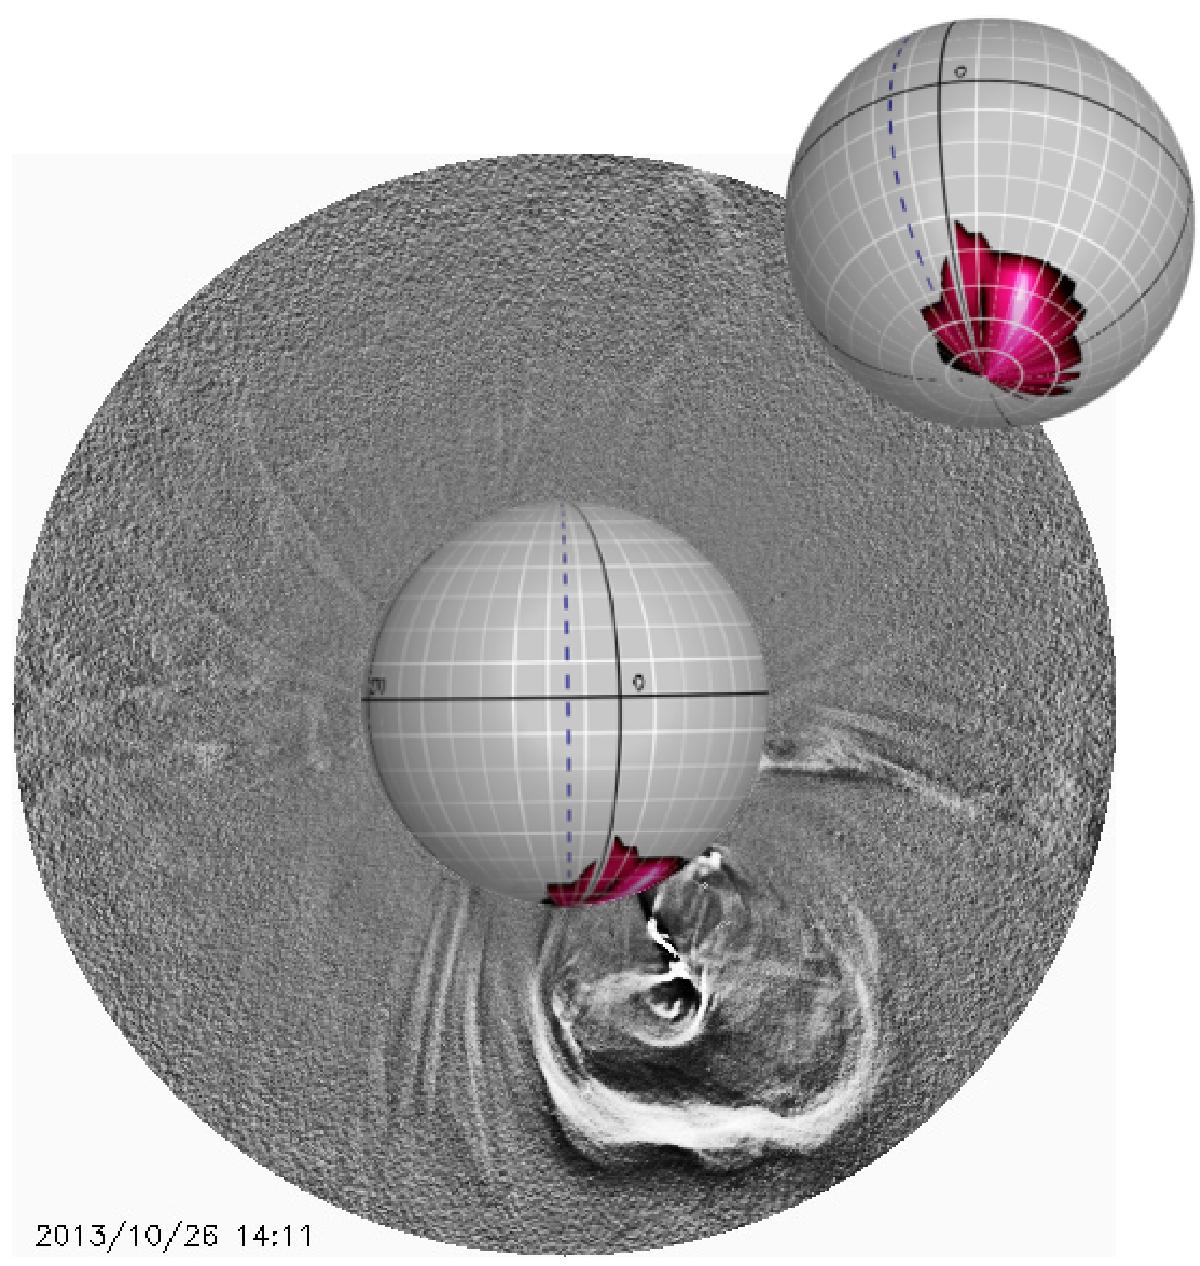
Results of the detection for the CME on the 26th October, 2013 (Fig. 8d) plotted onto the surface of a sphere and set into the centre of Fig. 8a to give context to the result. The meridional longitude is shown by the dashed line. The same spherical plot, orientated to better show the region of interest, is set into the top corner of the image.
Current usage metrics show cumulative count of Article Views (full-text article views including HTML views, PDF and ePub downloads, according to the available data) and Abstracts Views on Vision4Press platform.
Data correspond to usage on the plateform after 2015. The current usage metrics is available 48-96 hours after online publication and is updated daily on week days.
Initial download of the metrics may take a while.