Fig. 6
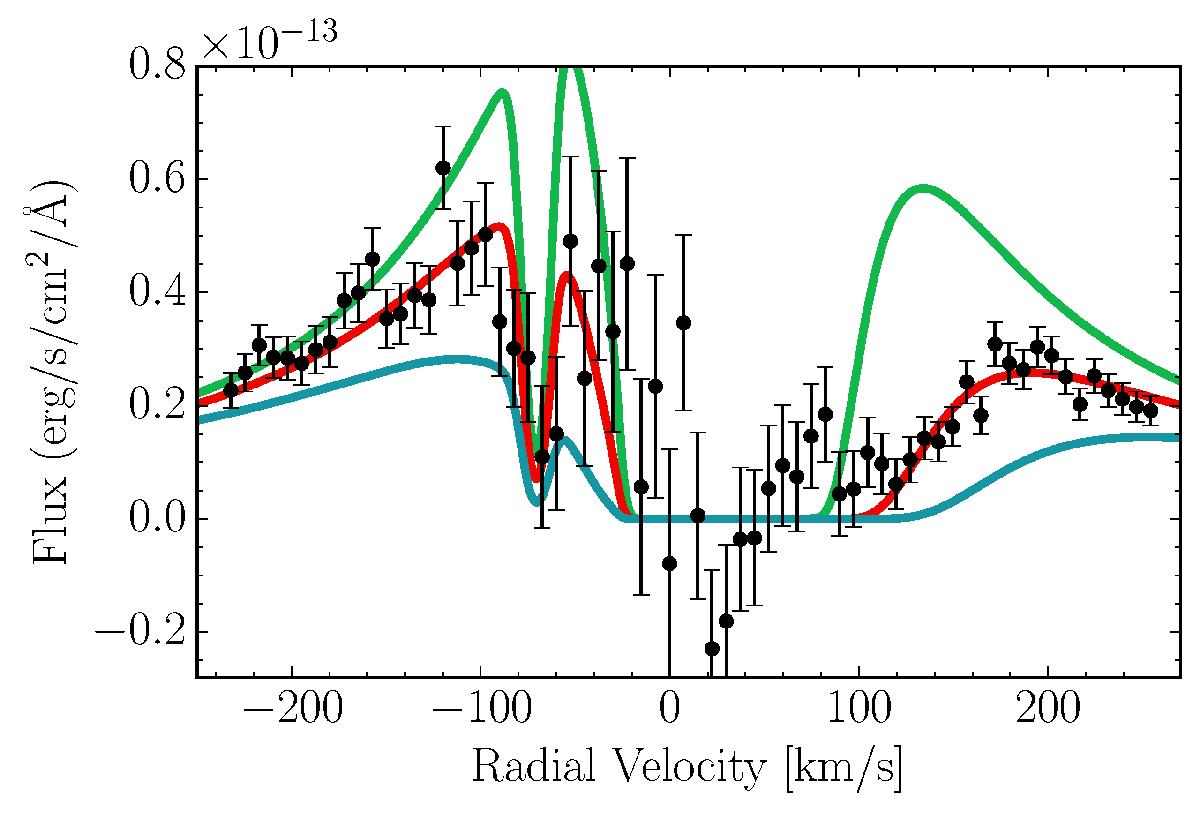
Measured flux of the Ly-α emission line as a function of radial velocity in the β Pic reference frame. For sake of clarity each data point has been created by calculating the average of three individual measurements. The lines in green, red and blue correspond to values of log (NH/ 1 cm2) of the β Pic absorption component equal to 18.0, 18.6 and 19.0 respectively, whilst keeping all other parameters constant. Fits generated with log (NH/ 1 cm2) different from the best fit at 18.6 produce significantly worse fits.
Current usage metrics show cumulative count of Article Views (full-text article views including HTML views, PDF and ePub downloads, according to the available data) and Abstracts Views on Vision4Press platform.
Data correspond to usage on the plateform after 2015. The current usage metrics is available 48-96 hours after online publication and is updated daily on week days.
Initial download of the metrics may take a while.