Fig. 5
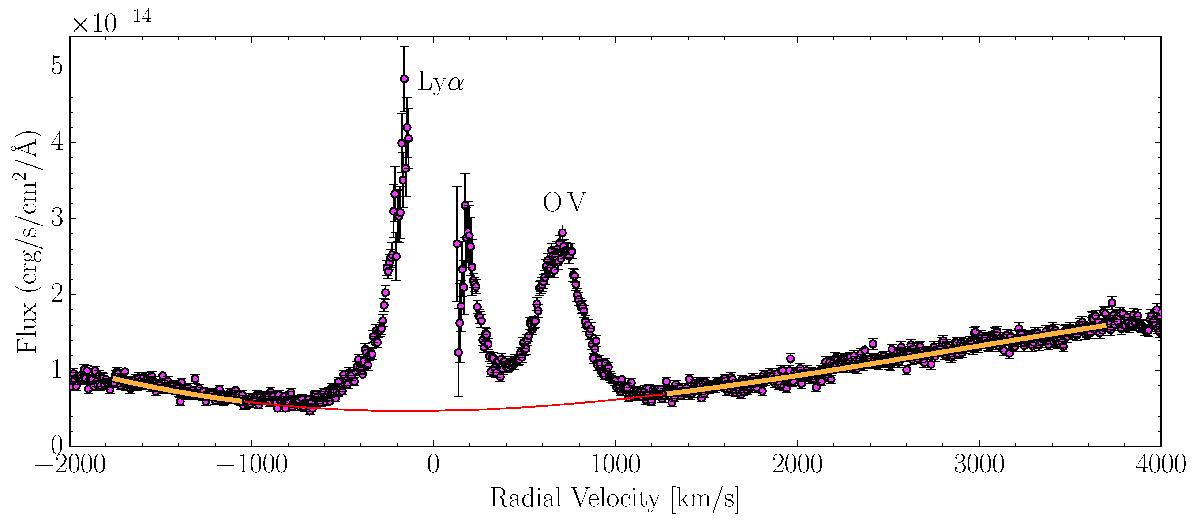
Measured flux as a function of radial velocity with respect to the Ly-α emission line in the β Pic reference frame. For sake of clarity each data point (pink points) has been created by calculating the average of three individual measurements. The data contaminated by airglow has been ignored (airglow-free) leaving a gap in the central part of the Ly-α profile. To model the very broad stellar Ly-α absorption line profile (see Sect. 4.1) we fit the flux continuum using a 4th order polynomial to produce a continuum model (thin red line) using the wavelength range covered by the bold orange line. Above the broad stellar absorption line, we see the narrower Ly-α emission line. The feature to the right of the Ly-α profile is the O V line at 1218.3440 Å (~700 km s-1).
Current usage metrics show cumulative count of Article Views (full-text article views including HTML views, PDF and ePub downloads, according to the available data) and Abstracts Views on Vision4Press platform.
Data correspond to usage on the plateform after 2015. The current usage metrics is available 48-96 hours after online publication and is updated daily on week days.
Initial download of the metrics may take a while.