Fig. 3
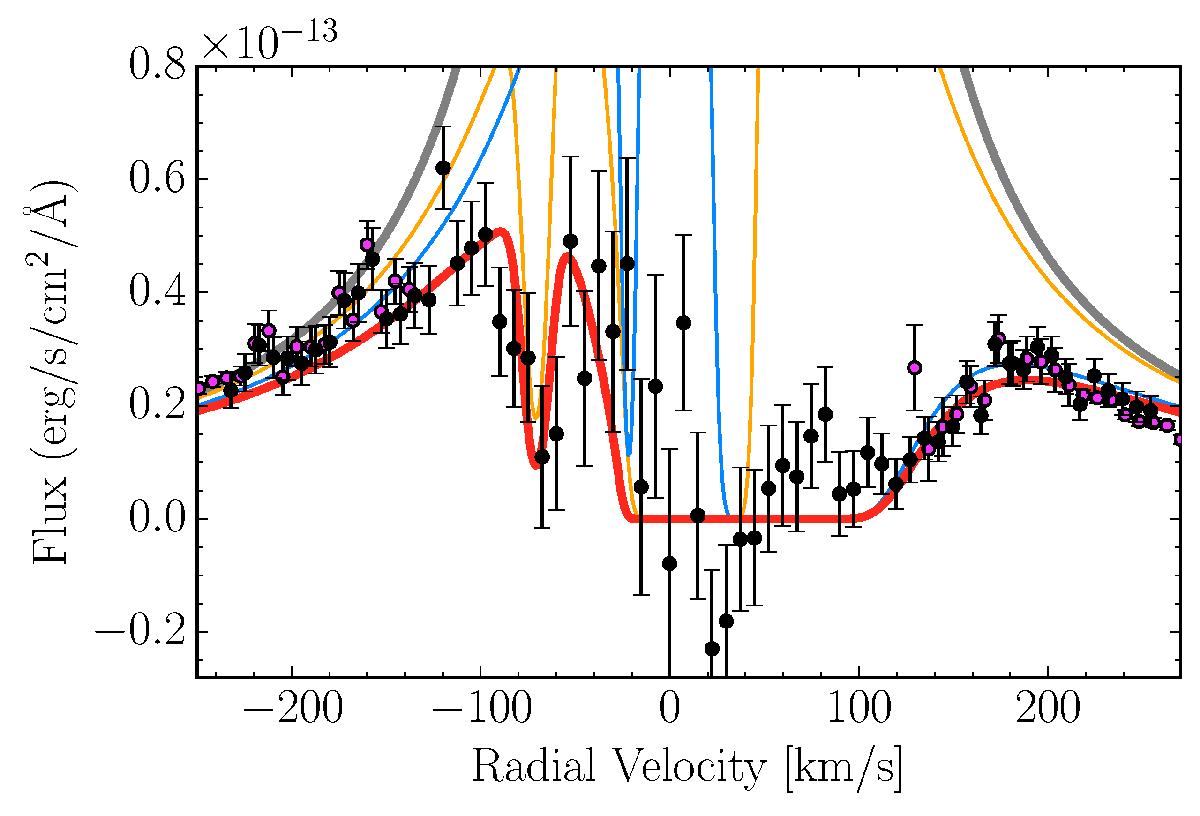
Measured flux of the Ly-α emission line as a function of radial velocity in the β Pic reference frame. For sake of clarity each data point has been created by calculating the average of three individual measurements. The data obtained using the AVM technique and ignoring the airglow contaminated regions (airglow-free) is shown as pink points. The sky subtracted (airglow-corrected) data is shown as black points which represent the weighted mean of each individual visit. The best fit model based on the airglow-corrected data is shown as a red line. This profile was calculated by subtracting the ISM absorption (ISM-absorbed line shown in yellow) and the absorption by the CS gas (CS-gas-absorbed line shown in blue) away from the stellar Lyman-α emission line (thick grey line). The final profile (red line) is convolved with the instrumental line spread function taken to be Gaussian with a full width at half maximum (FWHM) of 6.5 pix.
Current usage metrics show cumulative count of Article Views (full-text article views including HTML views, PDF and ePub downloads, according to the available data) and Abstracts Views on Vision4Press platform.
Data correspond to usage on the plateform after 2015. The current usage metrics is available 48-96 hours after online publication and is updated daily on week days.
Initial download of the metrics may take a while.