Fig. 1
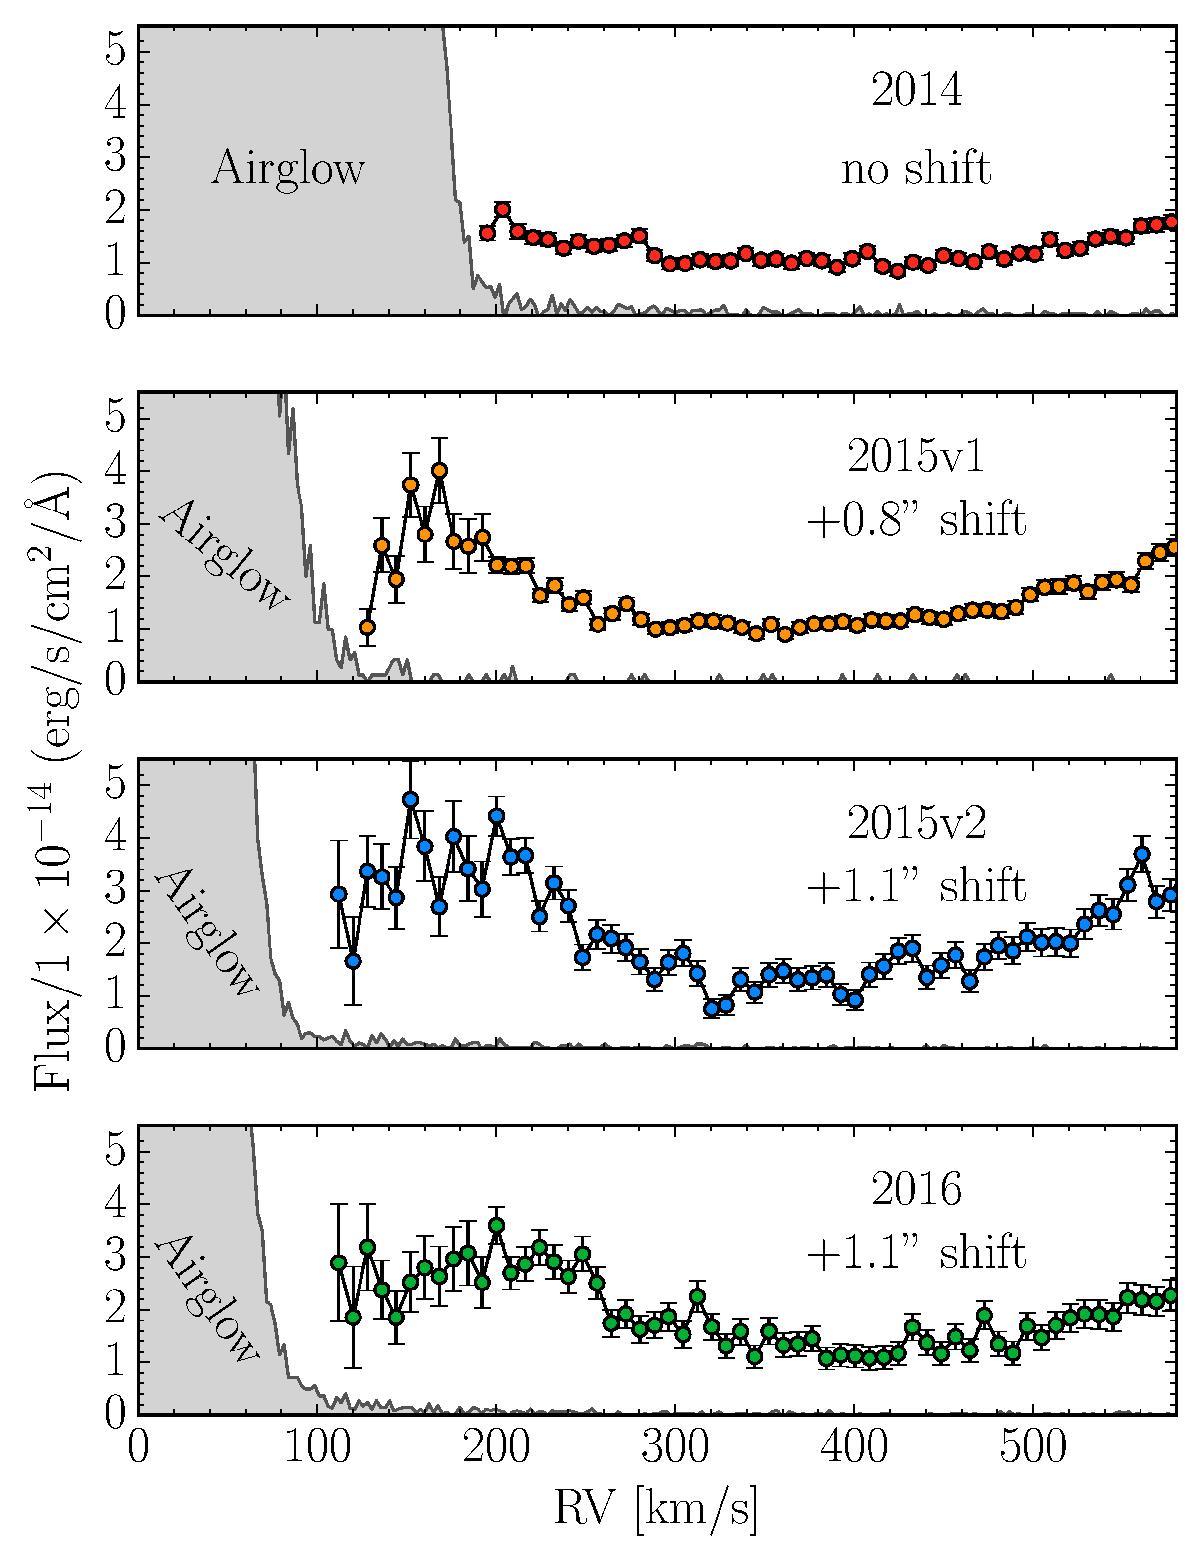
Red wing of the β Pic Lyman-α profile showing data not affected by airglow contamination. The measured flux is shown as a function of RV with respect to the β Pic reference frame. For sake of clarity each point has been created though calculating the average of three individual measurements. The “hook”-like feature seen for radial velocities less than ~150 km s-1 is due to the absorption by the hydrogen present in the CS gas surrounding β Pic. The data points covering the line core are not shown due to airglow contamination. Increasing the offset along the dispersion axis virtually move the airglow away and reveals more of the Ly-α profile. No shift was applied in 2014 resulting in the red points in the top panel which show only the start of the profile before the data is contaminated by the airglow. An 0.8′′ shift along the dispersion axis reveals the Ly-α down to ~122 km s-1 as shown by the data obtained during the first visit in 2015 (orange points shown in second panel from the top). For the largest shift of 1.1′′ done during the second visit of 2015 and the visit of 2016 (blue and green points in the lower panels respectively) the profile is revealed down to 115 km s-1.
Current usage metrics show cumulative count of Article Views (full-text article views including HTML views, PDF and ePub downloads, according to the available data) and Abstracts Views on Vision4Press platform.
Data correspond to usage on the plateform after 2015. The current usage metrics is available 48-96 hours after online publication and is updated daily on week days.
Initial download of the metrics may take a while.