Fig. 3
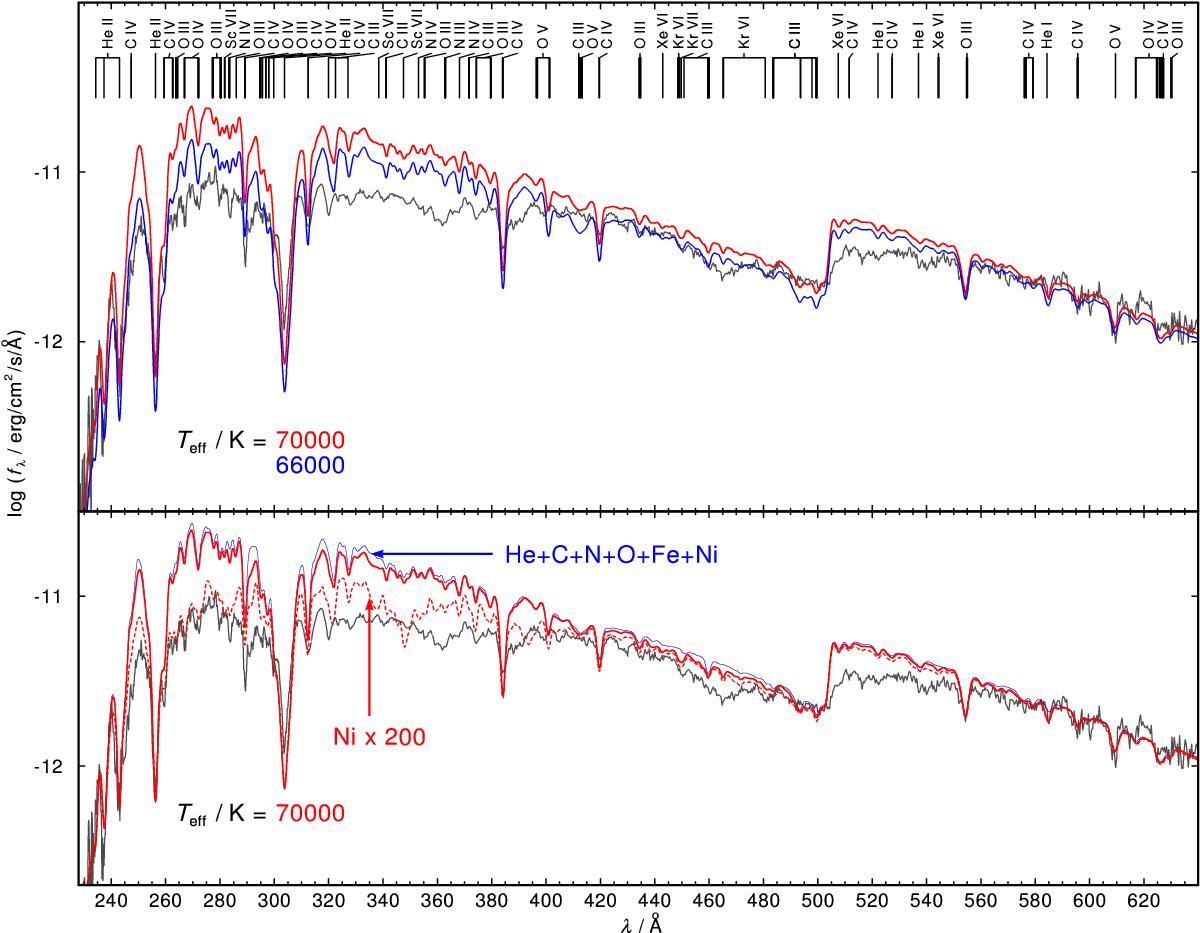
Comparison of the EUVE observation (gray line in both panels) with our models. Top panel: two models with Teff = 70 000 K (red) and Teff = 66 000 K (blue). Identified photospheric lines are marked at the top. Bottom panel: three models with Teff = 70 000 K. Red, thick line: model from the top panel, red, dashed line: model with 200 times increased Ni abundance, blue, thin line: model that considered only opacities of He, C, N, O, Fe, and Ni.
Current usage metrics show cumulative count of Article Views (full-text article views including HTML views, PDF and ePub downloads, according to the available data) and Abstracts Views on Vision4Press platform.
Data correspond to usage on the plateform after 2015. The current usage metrics is available 48-96 hours after online publication and is updated daily on week days.
Initial download of the metrics may take a while.