Fig. 2
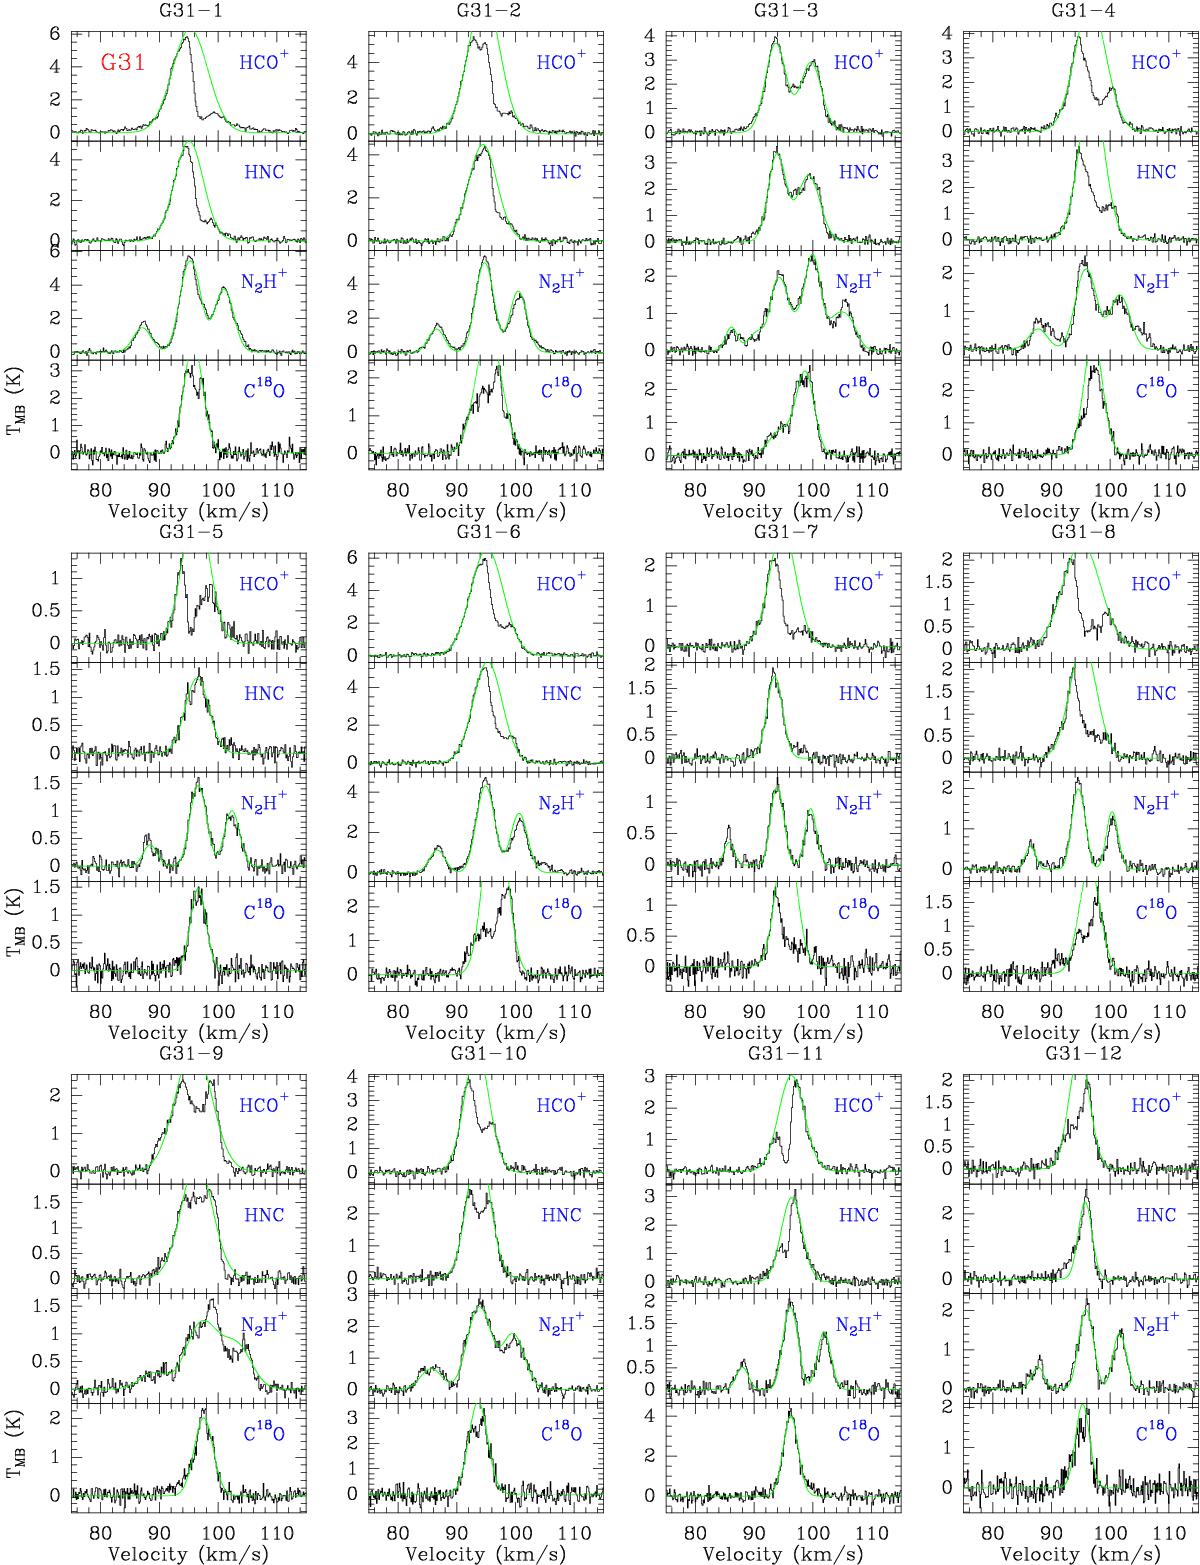
Spectra of HCO+, HNC, N2H+, and C18O extracted from each core in Fig. 1. These spectra are the average within one beam size (~27″). The green curves on N2H+ are from the HFS fit, and on other spectra are from the Gaussian fit by masking the absorption dip with GILDAS/CLASS software. To better show the HFS fit, the strongest HFS line was set the systemic velocity component (continuation in Fig. A.2).
Current usage metrics show cumulative count of Article Views (full-text article views including HTML views, PDF and ePub downloads, according to the available data) and Abstracts Views on Vision4Press platform.
Data correspond to usage on the plateform after 2015. The current usage metrics is available 48-96 hours after online publication and is updated daily on week days.
Initial download of the metrics may take a while.