Fig. 1
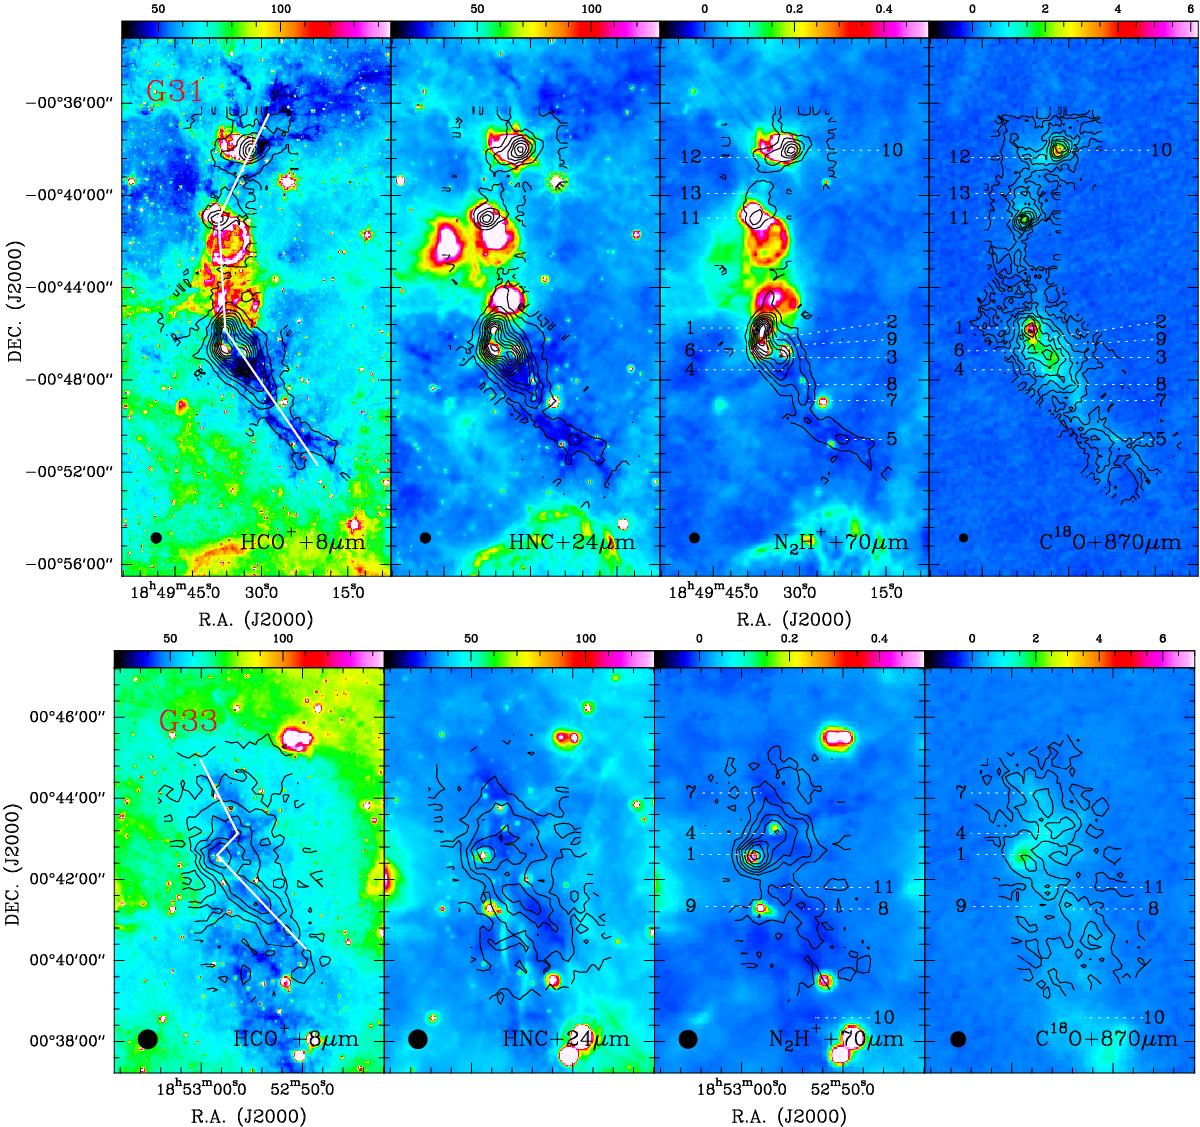
Integrated intensity maps of the HCO+, HNC, N2H+, and C18O lines superimposed on 8, 24, 70, and 870 μm emission toward IRDCs G31, G33, G34, G35, G38, and G53. Their integrated velocity ranges are (80, 110), (92, 117), (46, 70), (31, 52), (35, 57), and (12, 34) km s-1, respectively. For HCO+, HNC, N2H+, and C18O in these IRDCs, the contour levels start at 3–5σ in steps of 2–6σ, with σ = 0.75–1.10 K km s-1. The beam size of each subfigure is indicated at the bottom-left corner. The numbers indicate the positions of the selected cores, which are the same as those in Rathborne et al. (2006). The straight lines in the HCO+ subfigure show the cutting direction of the PV diagram in Fig. 3. The unit of each color bar is in MJy sr-1 for 8, 24, and 70 μm, and in Jy beam-1 for the 870 μm, respectively (continuation in Fig. A.1).
Current usage metrics show cumulative count of Article Views (full-text article views including HTML views, PDF and ePub downloads, according to the available data) and Abstracts Views on Vision4Press platform.
Data correspond to usage on the plateform after 2015. The current usage metrics is available 48-96 hours after online publication and is updated daily on week days.
Initial download of the metrics may take a while.