Fig. 7
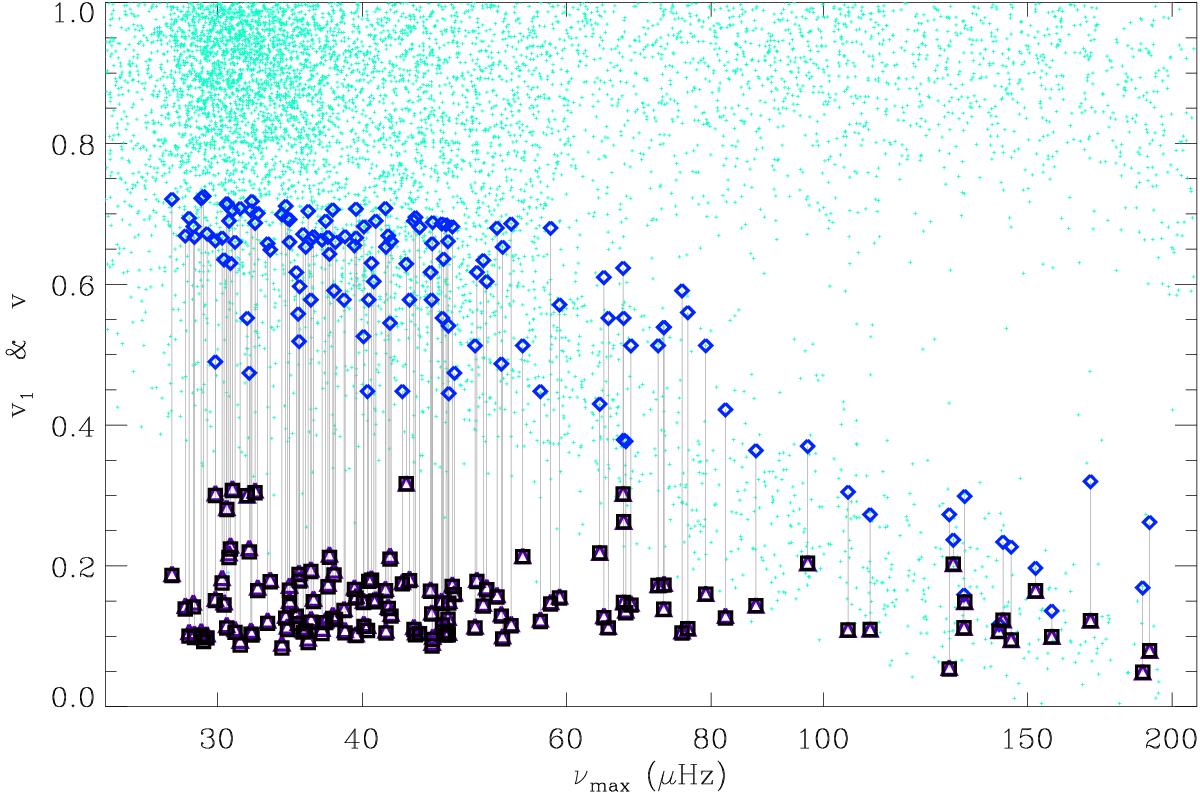
Observed visibilities v1 for the Kepler public data set of red giants, as a function of νmax. Values for stars showing depressed mixed modes are emphasized with large diamonds and compared to the computed visibilities: large dark triangles for the low-coupling case (Eq. (16), as in Unno et al. 1989; Fuller et al. 2015) are very close to black squares for the strong-coupling case (Eq. (20)). Gray lines connect the observed and modeled values.
Current usage metrics show cumulative count of Article Views (full-text article views including HTML views, PDF and ePub downloads, according to the available data) and Abstracts Views on Vision4Press platform.
Data correspond to usage on the plateform after 2015. The current usage metrics is available 48-96 hours after online publication and is updated daily on week days.
Initial download of the metrics may take a while.