Fig. 5
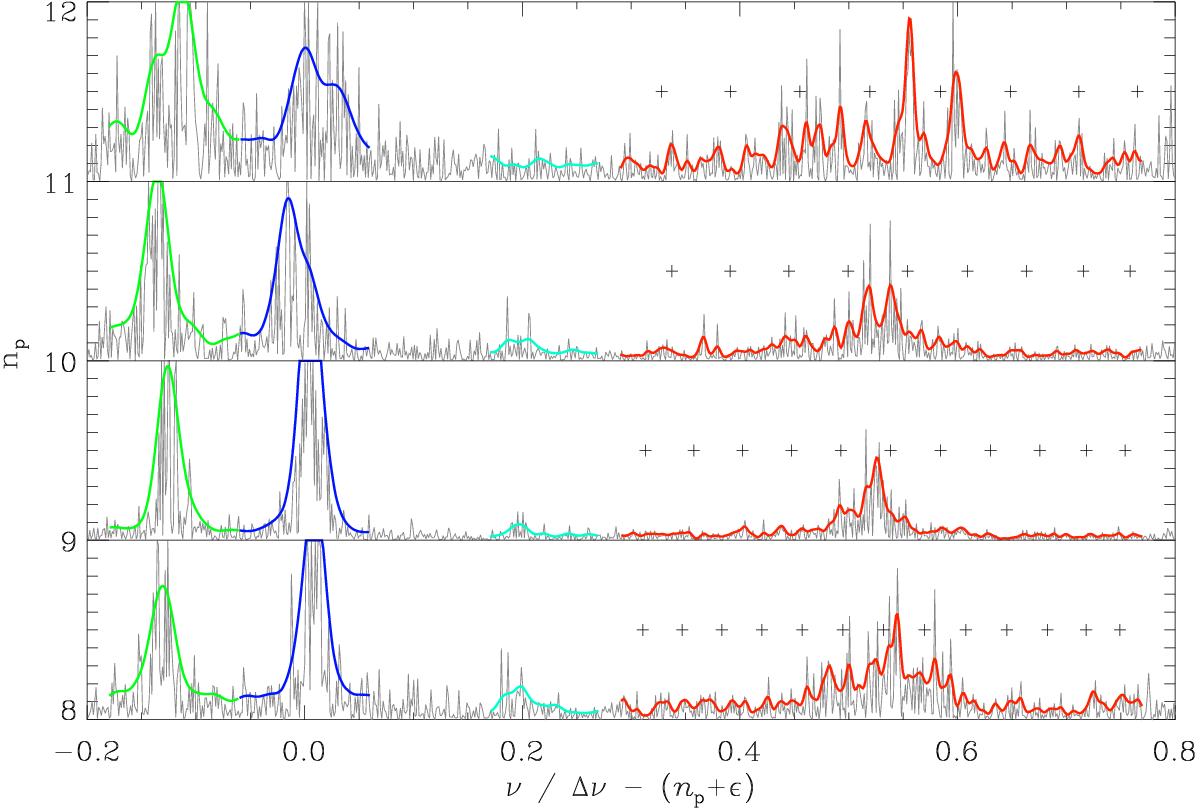
Échelle spectrum of the RGB star KIC 9711269. Colored lines, with the same color code as in Fig. 1, emphasize the structure of the modes. Plus symbols approximately indicate the period spacings derived from the asymptotic expansion; the fit of the mixed modes, which would imply the fit of the rotational splittings, is however not possible.
Current usage metrics show cumulative count of Article Views (full-text article views including HTML views, PDF and ePub downloads, according to the available data) and Abstracts Views on Vision4Press platform.
Data correspond to usage on the plateform after 2015. The current usage metrics is available 48-96 hours after online publication and is updated daily on week days.
Initial download of the metrics may take a while.