Fig. 4
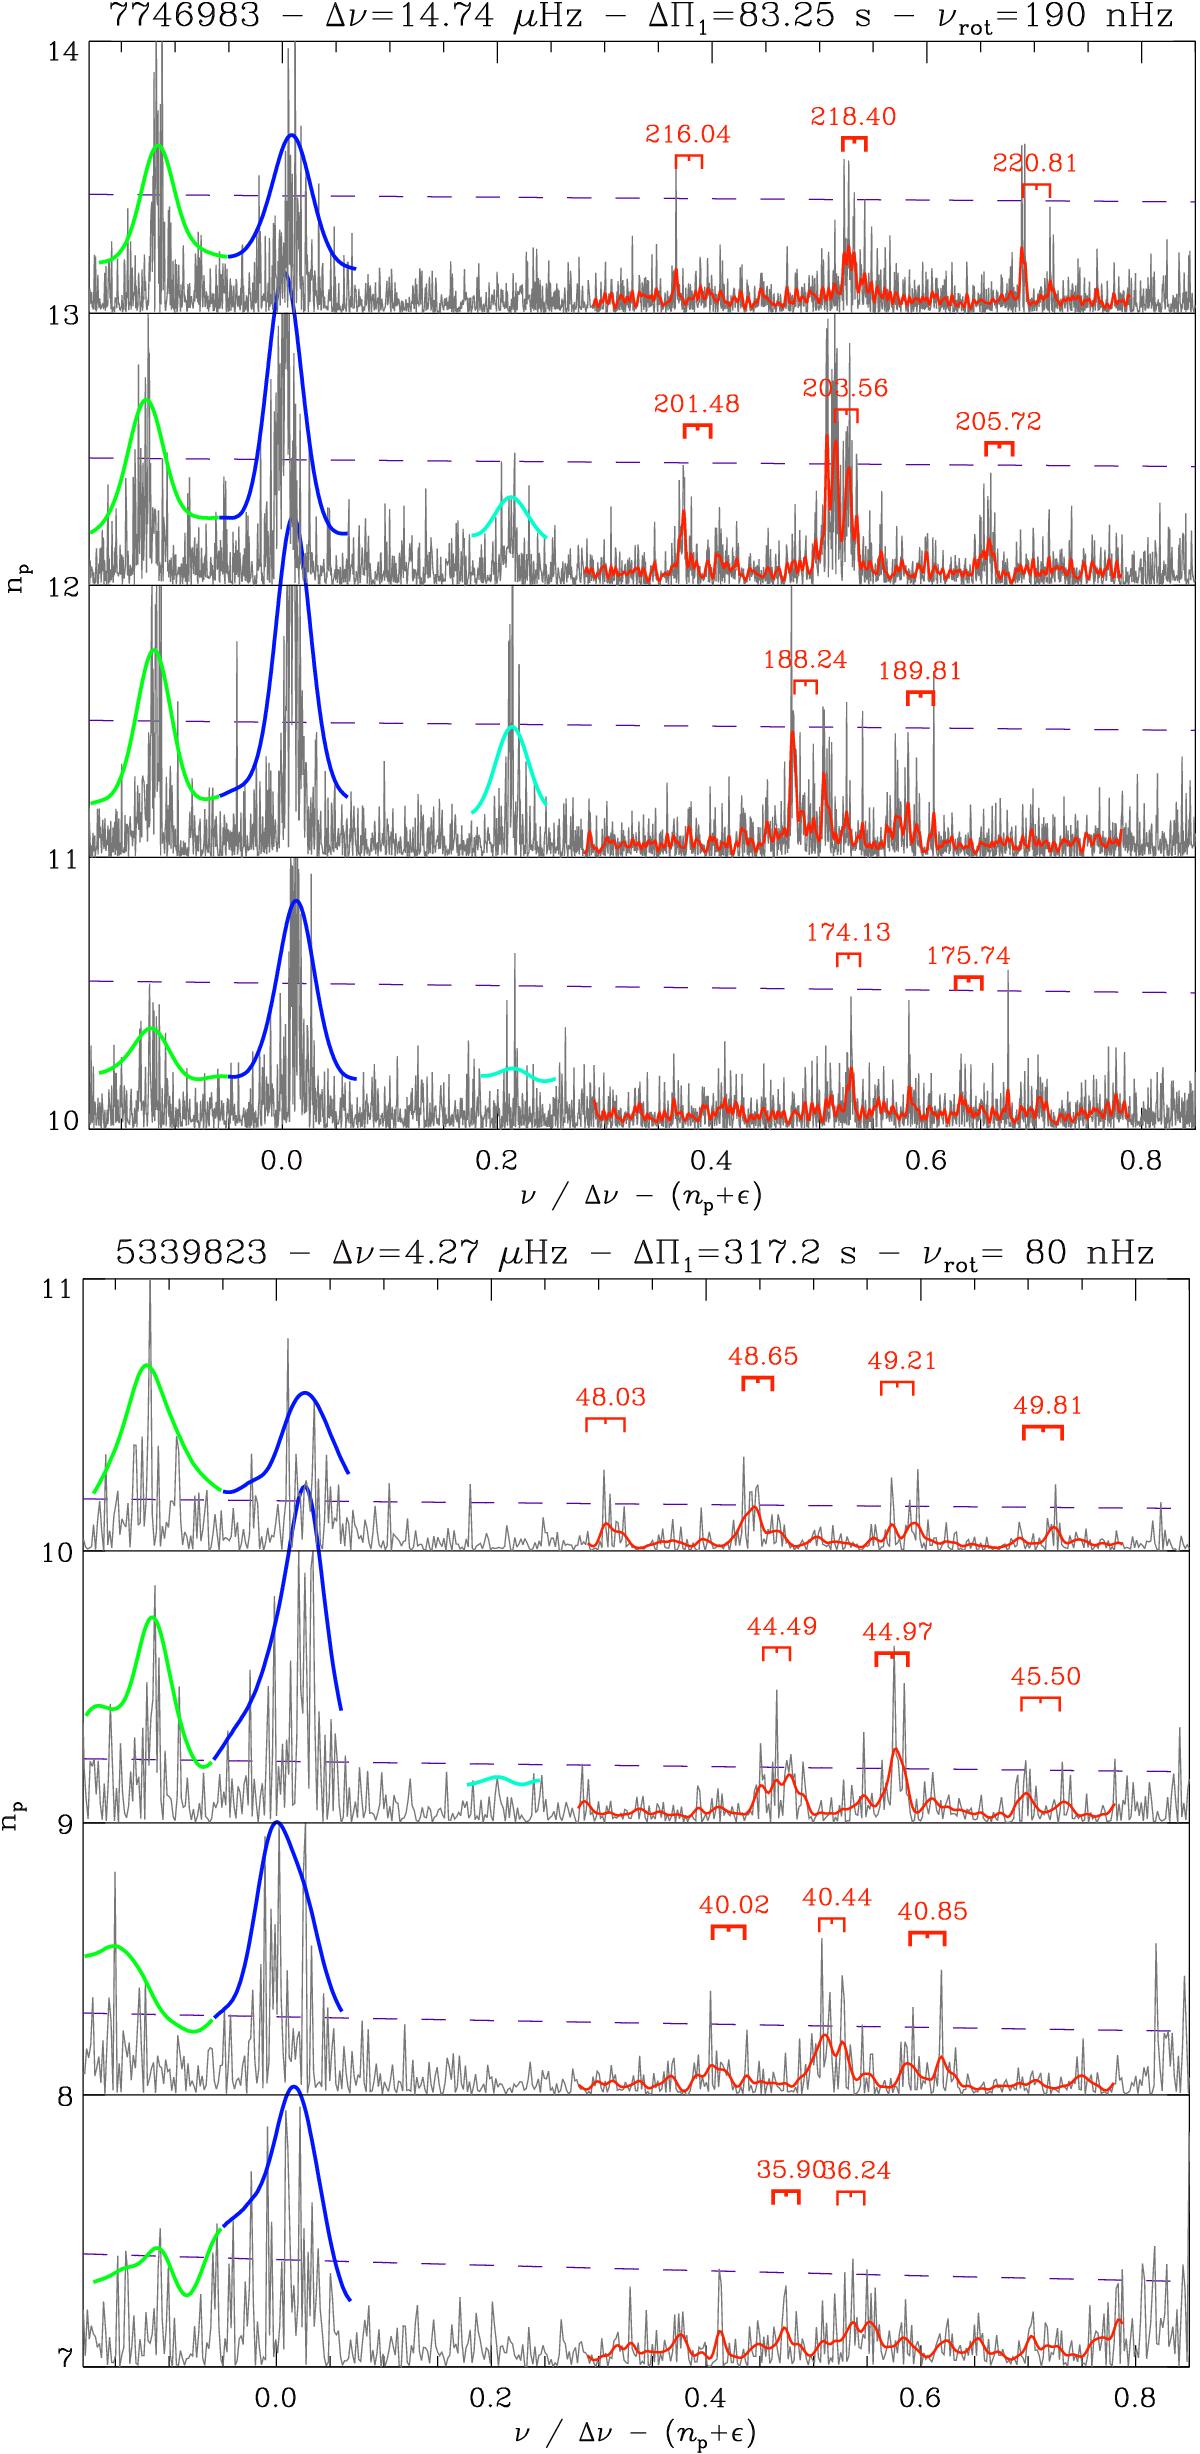
Examples of complete fits of the asymptotic mixed-mode pattern of red giants with low dipole-mode amplitudes. Échelle diagrams are plotted as a function of the reduced frequency ν/ Δν−(np + ε), so that radial modes are close to integer values. The smoothed profile of mixed modes are plotted in red, quadrupole modes in green, and octupole modes in cyan. The dashed gray line corresponds to 8 times the granulation background. Dipole triplets are identified by the asymptotic cyclic frequency, in μHz, of the m = 0 component. Top: RGB star, KIC 7746983; bottom: Clump star, KIC 5339823.
Current usage metrics show cumulative count of Article Views (full-text article views including HTML views, PDF and ePub downloads, according to the available data) and Abstracts Views on Vision4Press platform.
Data correspond to usage on the plateform after 2015. The current usage metrics is available 48-96 hours after online publication and is updated daily on week days.
Initial download of the metrics may take a while.