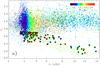
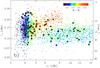
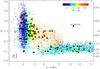
Fig. 3
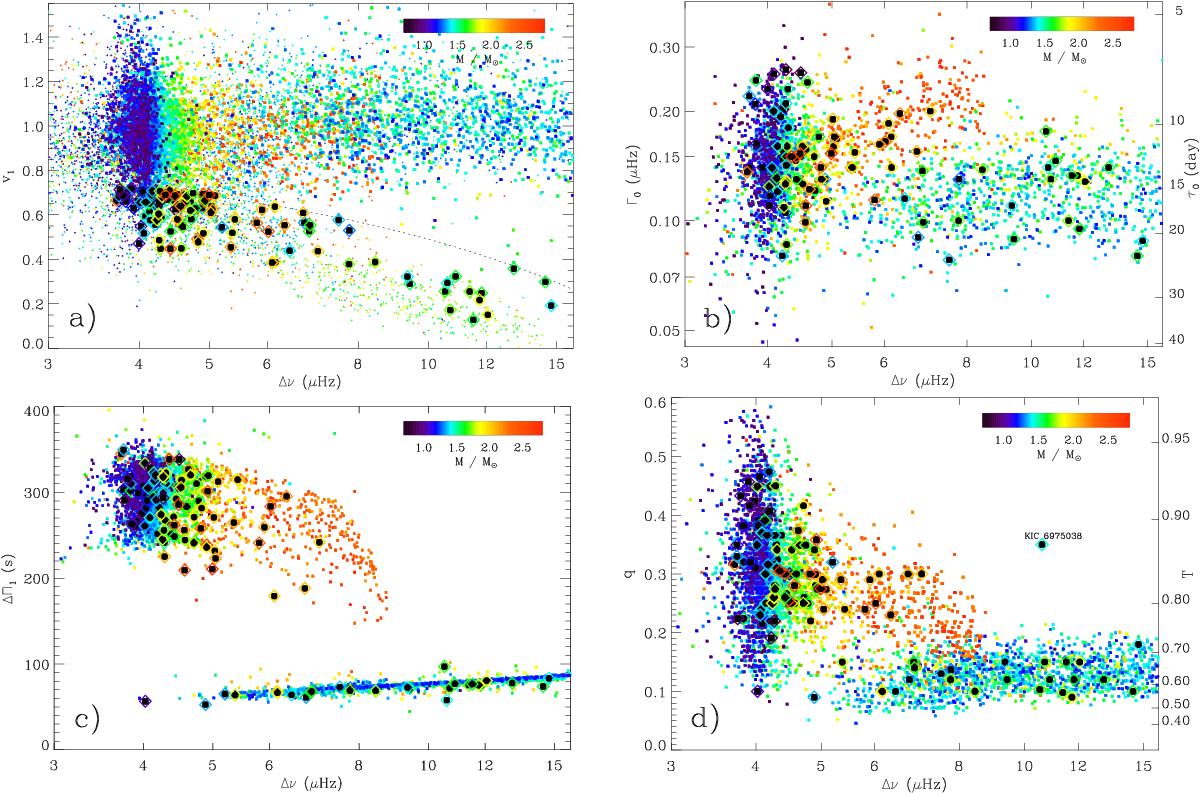
a) Dipole mode visibility v1 as a function of the large separation Δν. The color codes the mass determined with seismic scaling relations. Small symbols represent Kepler stars of the public data set; and larger symbols represent stars of the data set studied by Vrard et al. (2016). Diamonds with a dark center are stars showing depressed mixed modes. The dashed line represents the limit defining low visibilities. b) Radial mode width Γ0 as a function of the large separation Δν of the data set studied by Vrard et al. (2016). The right y-axis provides the radial mode lifetime. c) Same as b) for the period spacings ΔΠ1; and d) same as b) for the coupling factor q. The outlying value of q for KIC 6975038 is discussed in Sect. 5.4.
Current usage metrics show cumulative count of Article Views (full-text article views including HTML views, PDF and ePub downloads, according to the available data) and Abstracts Views on Vision4Press platform.
Data correspond to usage on the plateform after 2015. The current usage metrics is available 48-96 hours after online publication and is updated daily on week days.
Initial download of the metrics may take a while.