Fig. 8
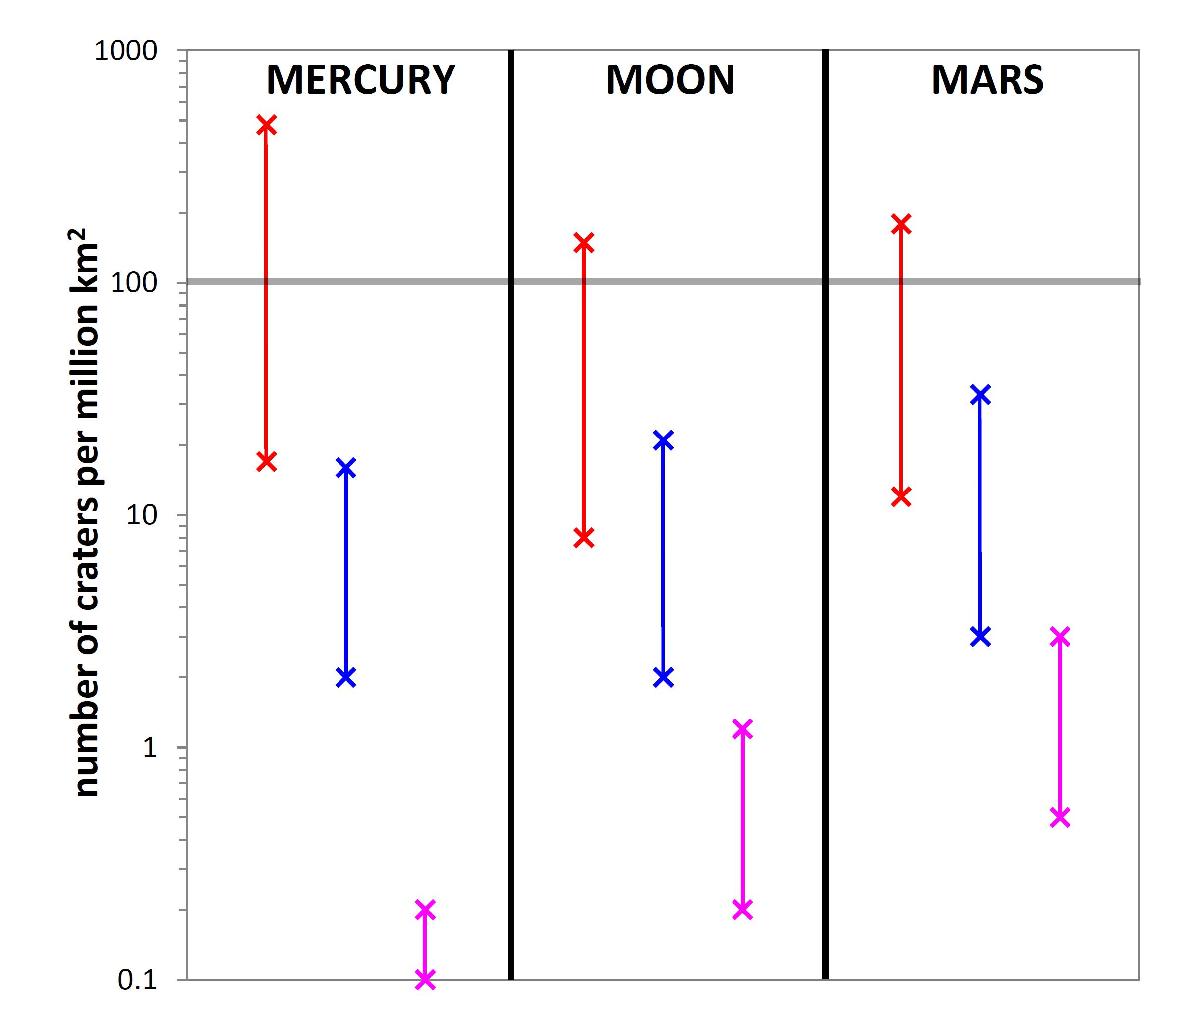
Areal density of D > 20 km craters for Mercury, the Moon and Mars. For each target the three physical evolution models are plotted using the same colours as in Fig. 4. The upper cross is for the steeper size distribution of the small disk objects, and the lower cross is for the shallower one. The low mass disk is used in both cases. The lines at the common level of 100 craters per million km2 mark the observational reference data.
Current usage metrics show cumulative count of Article Views (full-text article views including HTML views, PDF and ePub downloads, according to the available data) and Abstracts Views on Vision4Press platform.
Data correspond to usage on the plateform after 2015. The current usage metrics is available 48-96 hours after online publication and is updated daily on week days.
Initial download of the metrics may take a while.