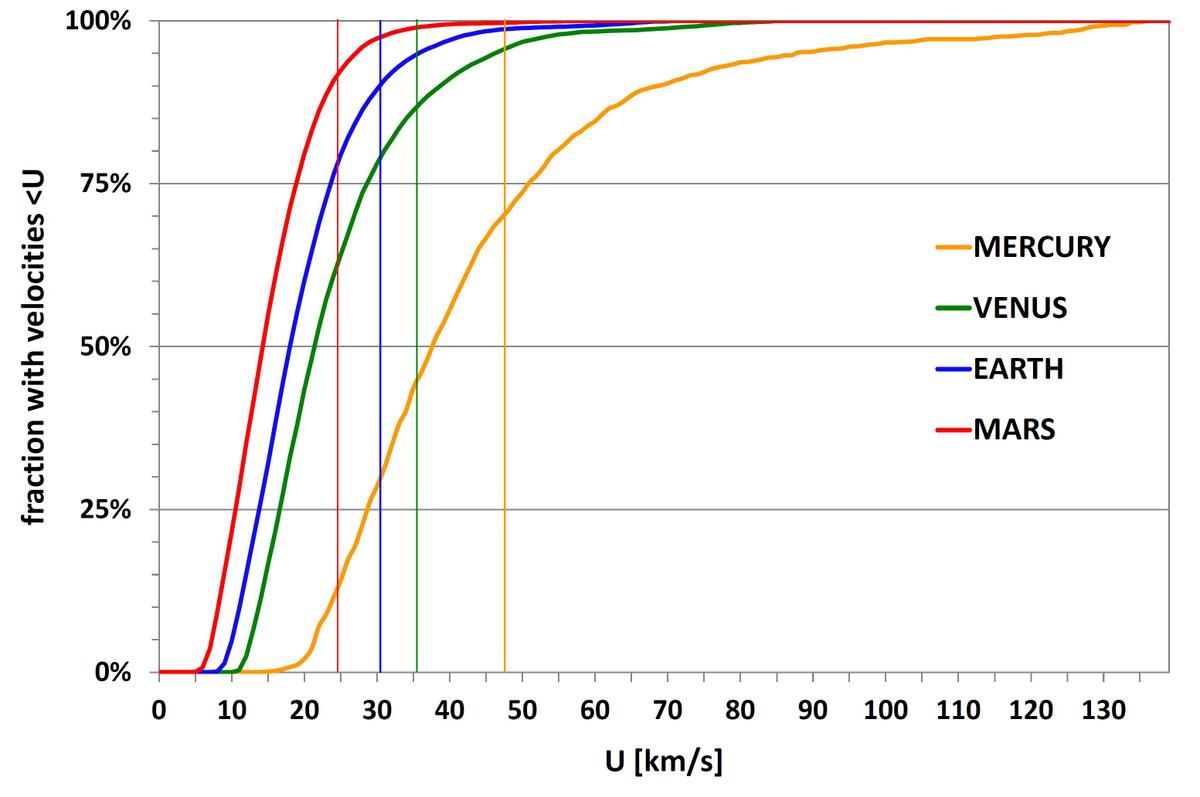
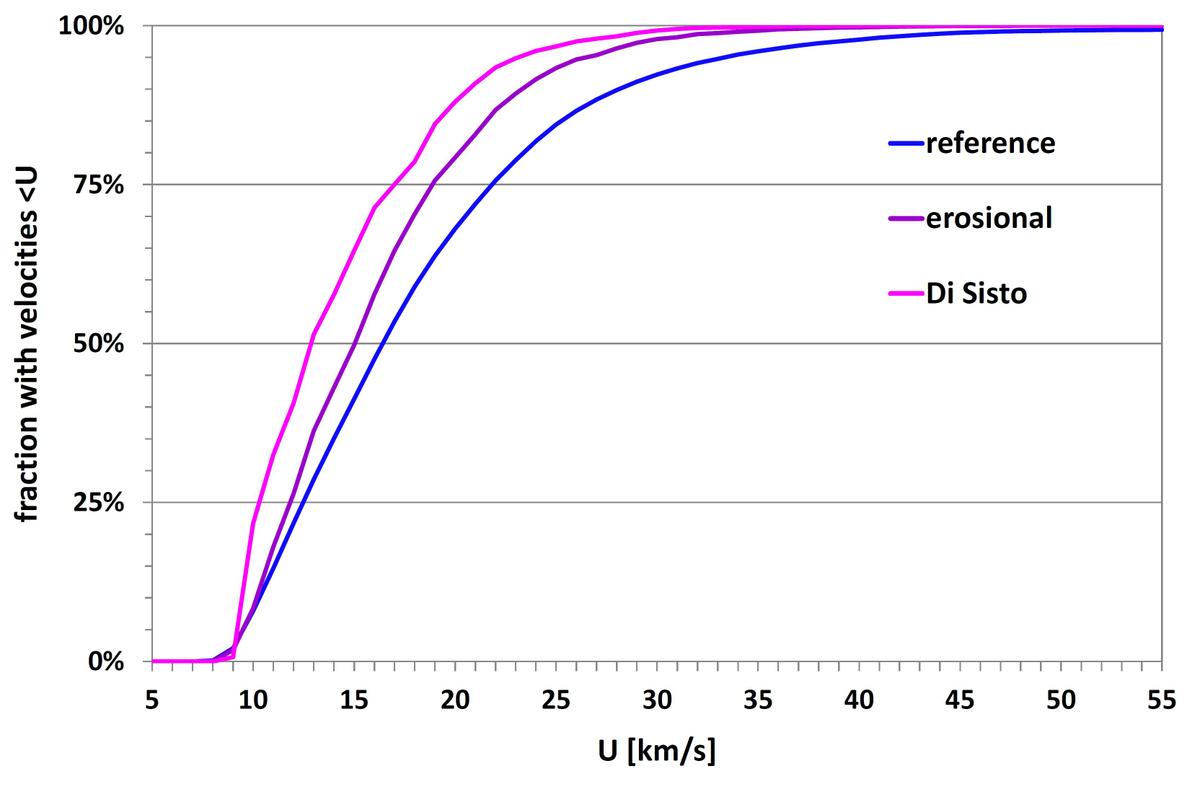
Fig. 6
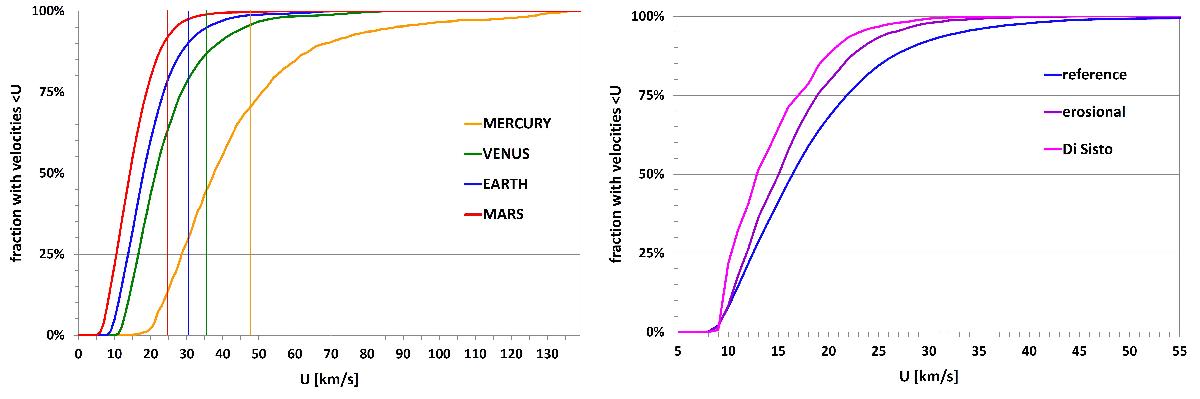
Left panel: cumulative distributions of approach velocities to different planets for collisional orbits in the reference model. The curve for Mercury shows some wiggles owing to relatively sparse material. The thin vertical lines indicate the circular speeds at the mean distance of each planet. Right panel: cumulative distributions of approach velocities to the Earth for collisional orbits in the reference, erosional and Di Sisto models. For the latter two, the slope index s1 = 2.5 has been used. The wiggles in the curve for the Di Sisto model are due to the sparse material.
Current usage metrics show cumulative count of Article Views (full-text article views including HTML views, PDF and ePub downloads, according to the available data) and Abstracts Views on Vision4Press platform.
Data correspond to usage on the plateform after 2015. The current usage metrics is available 48-96 hours after online publication and is updated daily on week days.
Initial download of the metrics may take a while.