Fig. 4
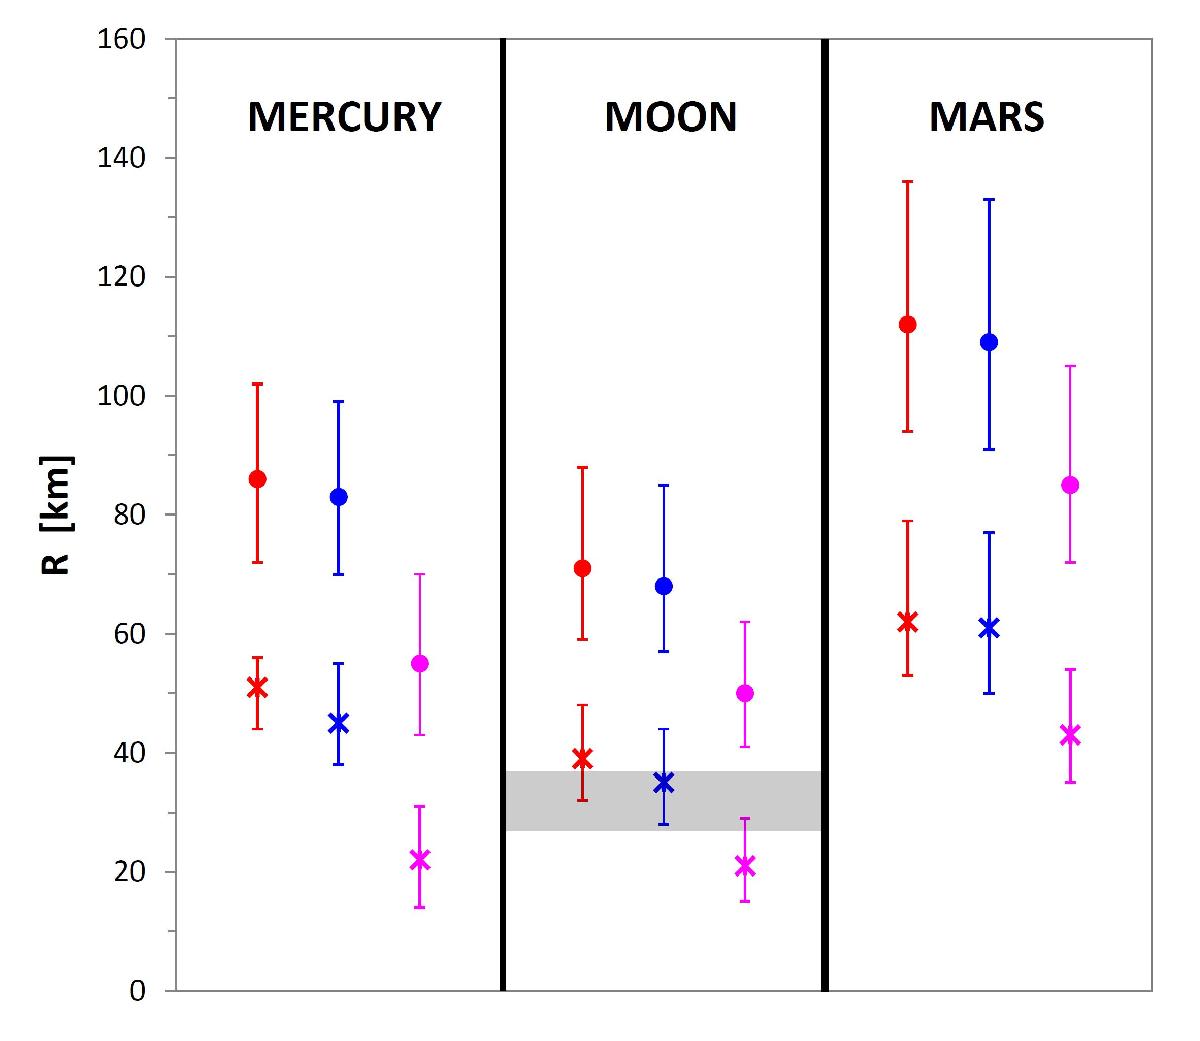
Maximum cometary impactor radius for Mercury, the Moon and Mars. Each error bar extends from the lower to the upper quartile of the cumulative probability distribution with the median marked by a filled circle for the maximum model and a cross for the minimum model of the disk. The red colour is used for the reference model, the blue colour for the erosional model, and the magenta colour for the Di Sisto model. The shaded band for the Moon indicates an observational constraint based on the Jupiter Trojan population (see the main text).
Current usage metrics show cumulative count of Article Views (full-text article views including HTML views, PDF and ePub downloads, according to the available data) and Abstracts Views on Vision4Press platform.
Data correspond to usage on the plateform after 2015. The current usage metrics is available 48-96 hours after online publication and is updated daily on week days.
Initial download of the metrics may take a while.