Fig. 1
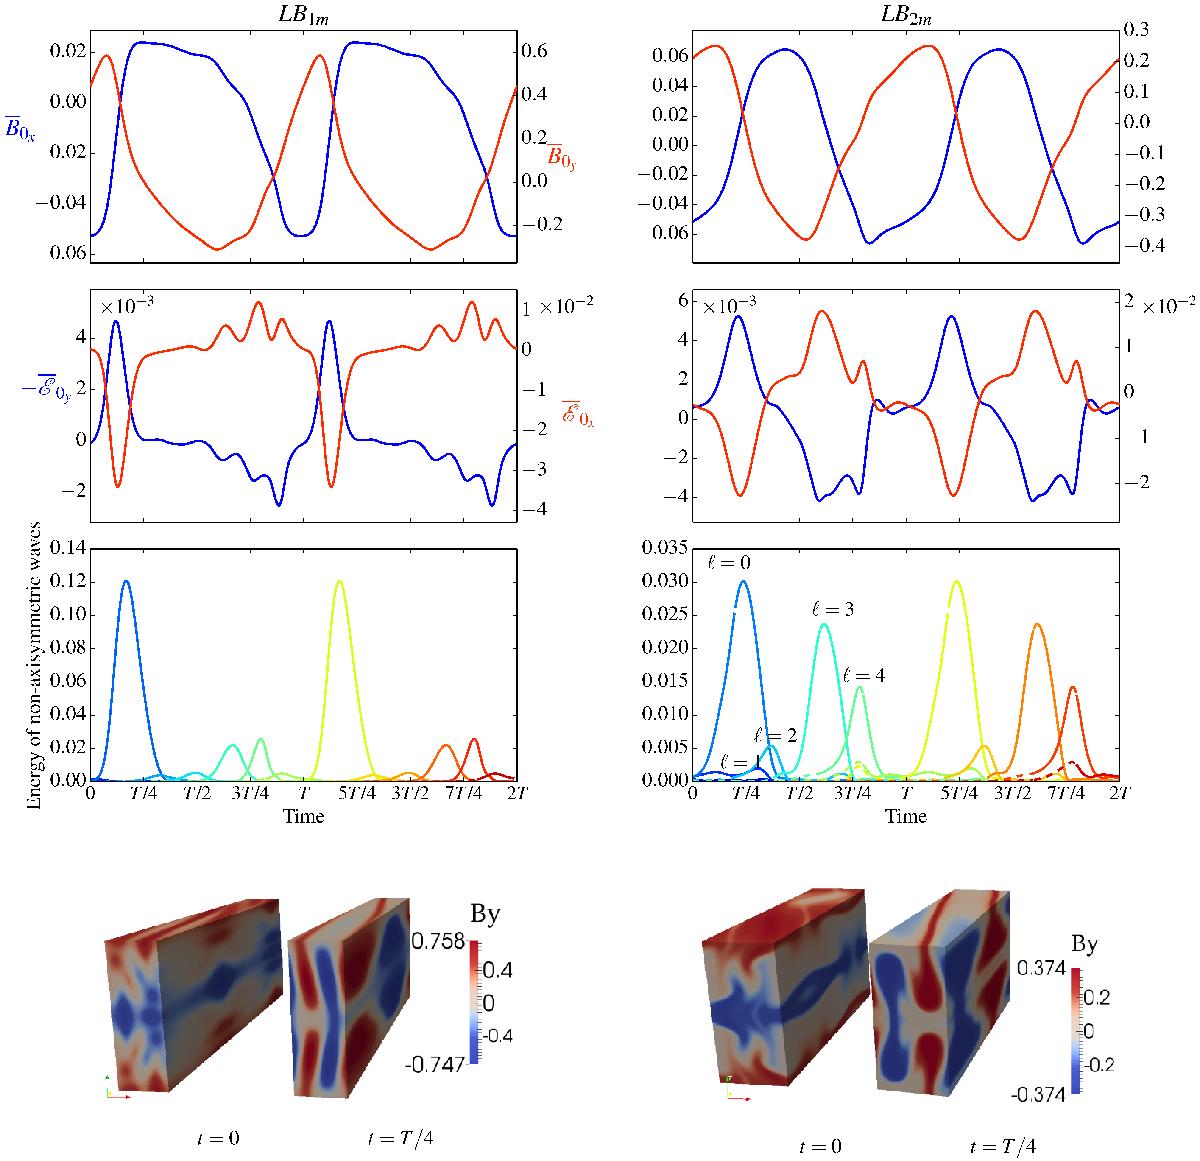
Temporal evolution and dynamical decomposition of the lower branch solutions LB1m (left) and LB2m (right). LB1m is shown for Re = 100, Rm = 900 and LB2m for Re = 908, Rm = 3033. From top to bottom, axisymmetric field ![]() , axisymmetric EMF (ℰ0x,−ℰ0y) and total energy (integrated over all kz) of each shearing wave packet (ky = 2π/Ly) as a function of time (two cycle periods are represented). The rainbow colours and ℓ in the bottom plots represent successive shearing wave packets (see Sects. 2–4). The 3D visualizations show isosurfaces of By at t = 0 and t = T0/ 4, where T0 is the period of the corresponding cycle. Videos showing the total By and the poloidal velocity streamlines for SN1m and SN2m are available online.
, axisymmetric EMF (ℰ0x,−ℰ0y) and total energy (integrated over all kz) of each shearing wave packet (ky = 2π/Ly) as a function of time (two cycle periods are represented). The rainbow colours and ℓ in the bottom plots represent successive shearing wave packets (see Sects. 2–4). The 3D visualizations show isosurfaces of By at t = 0 and t = T0/ 4, where T0 is the period of the corresponding cycle. Videos showing the total By and the poloidal velocity streamlines for SN1m and SN2m are available online.
Current usage metrics show cumulative count of Article Views (full-text article views including HTML views, PDF and ePub downloads, according to the available data) and Abstracts Views on Vision4Press platform.
Data correspond to usage on the plateform after 2015. The current usage metrics is available 48-96 hours after online publication and is updated daily on week days.
Initial download of the metrics may take a while.