Fig. 5
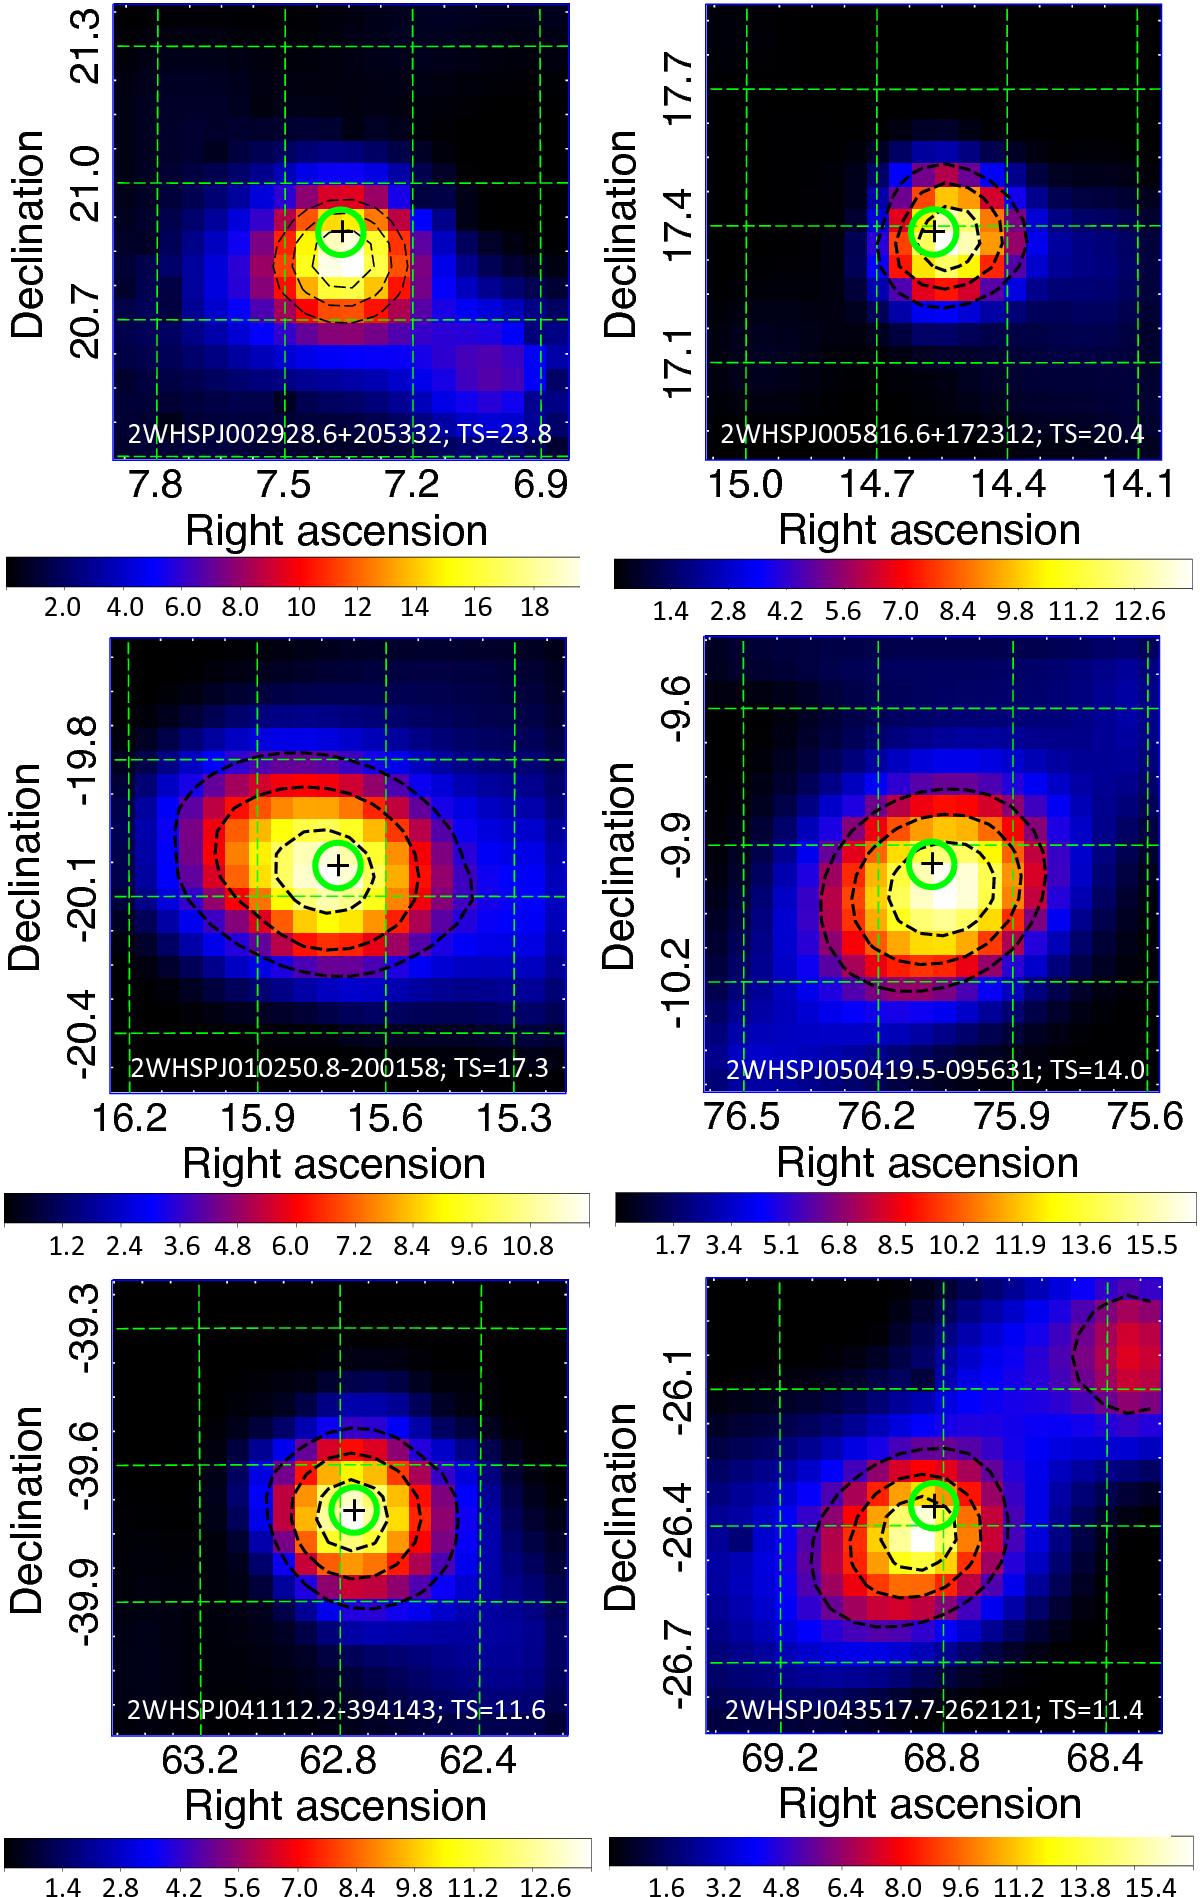
TS maps in the 0.6−500 GeV band for six sources representing the lower-significance detections with TS between 10 to 25. At the bottom of each map, we write the corresponding source name and the reported TS value for a binned likelihood analysis when integration is over 7.2 yr of observations (along the full energy band 0.3−500 GeV). The 2WHSP positions are highlighted by thick green circles with their centered on +. The contour black dashed lines are TS surfaces representing 68%, 95%, and 99% containment region for the γ-ray signature (from inner to outer lines).
Current usage metrics show cumulative count of Article Views (full-text article views including HTML views, PDF and ePub downloads, according to the available data) and Abstracts Views on Vision4Press platform.
Data correspond to usage on the plateform after 2015. The current usage metrics is available 48-96 hours after online publication and is updated daily on week days.
Initial download of the metrics may take a while.