Fig. 3
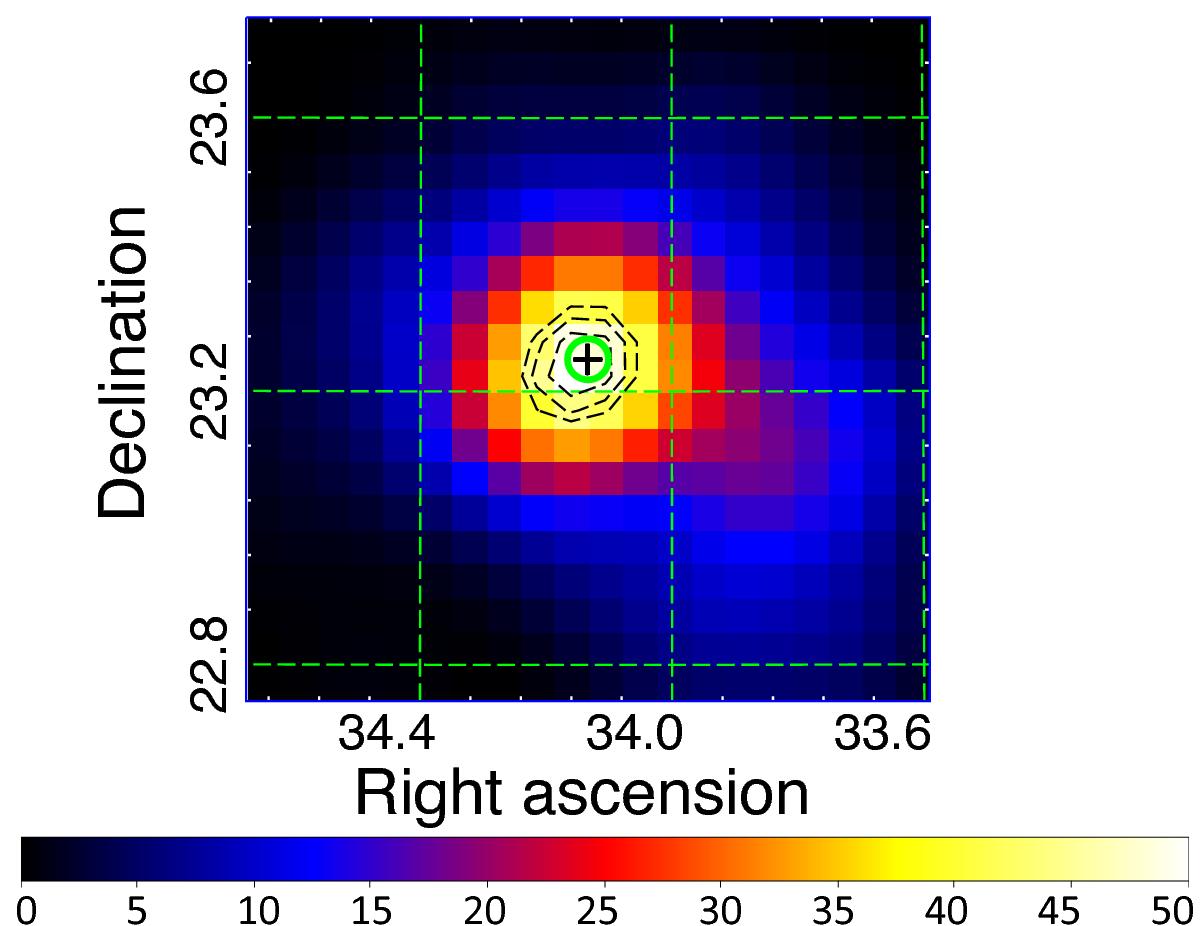
TS map (3−500 GeV), having 20 × 20 pixels and built with resolution 0.05°/pixel, integrating over 7 yr of Fermi-LAT observations. The green circle centered on + highlights the position of 2WHSP J021631.9+231449; contour dashed lines correspond, respectively, to the 68%, 95%, and 99% confinement regions (from inner to outer lines) for the γ-ray signature position.
Current usage metrics show cumulative count of Article Views (full-text article views including HTML views, PDF and ePub downloads, according to the available data) and Abstracts Views on Vision4Press platform.
Data correspond to usage on the plateform after 2015. The current usage metrics is available 48-96 hours after online publication and is updated daily on week days.
Initial download of the metrics may take a while.