Fig. 17
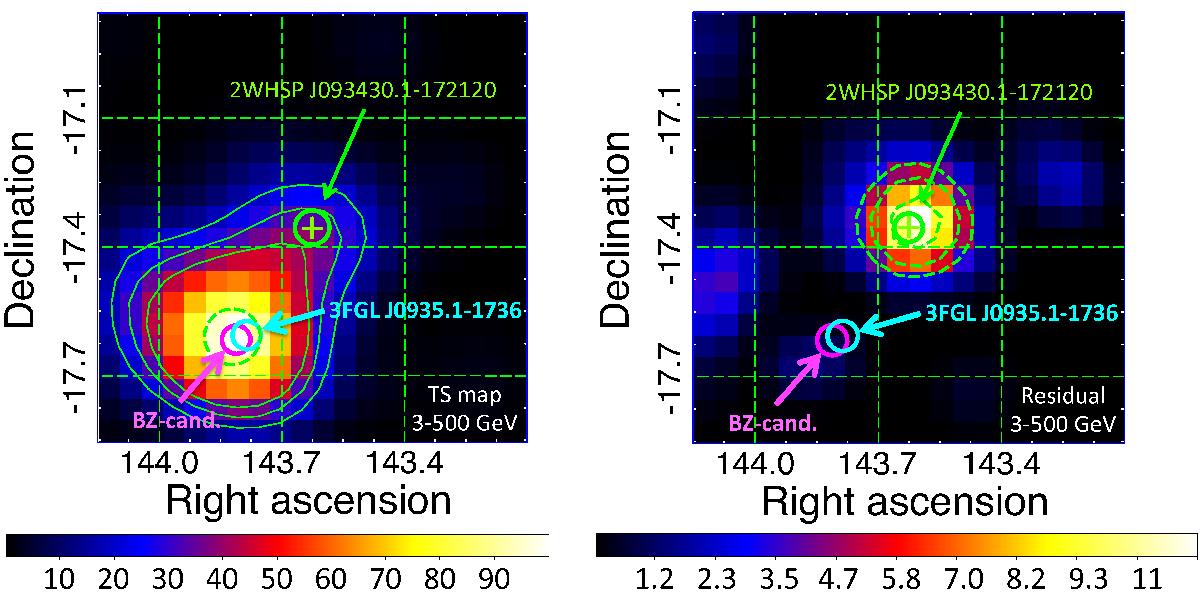
High-energy TS-maps 3−500 GeV with 20 × 20 grid 0.05°/pixel, integrating over 7 yr of data. In both maps the 2WHSP J093430.1-172120 position is highlighted by a thick green circle centered on +; the 3FGL J0935.1-1736 is in the center of the thick cyan circle, and a blazar candidate (possible counterpart for the 3FGL source) is indicated with a thick magenta circle. Left panel: for this map, the 3FGL source is removed from the model input, showing the pure shape of TS distribution in the region. Green dashed line represents the 99% containment region for the γ-ray signature, which is compatible both with 3FGL and blazar candidate positions. The thin contour lines refer to TS surfaces of 40-30-20, only to show how the γ-ray signature is extended, matching the 2WHSP J093430.1-172120. Right panel: residual TS map (built using the 3FGL in the background) showing excess signal consistent with a point-like source. The green dashed lines correspond to the 68%, 95%, and 99% containment region for the γ-ray signature (from inner to outer lines).
Current usage metrics show cumulative count of Article Views (full-text article views including HTML views, PDF and ePub downloads, according to the available data) and Abstracts Views on Vision4Press platform.
Data correspond to usage on the plateform after 2015. The current usage metrics is available 48-96 hours after online publication and is updated daily on week days.
Initial download of the metrics may take a while.