Fig. 16
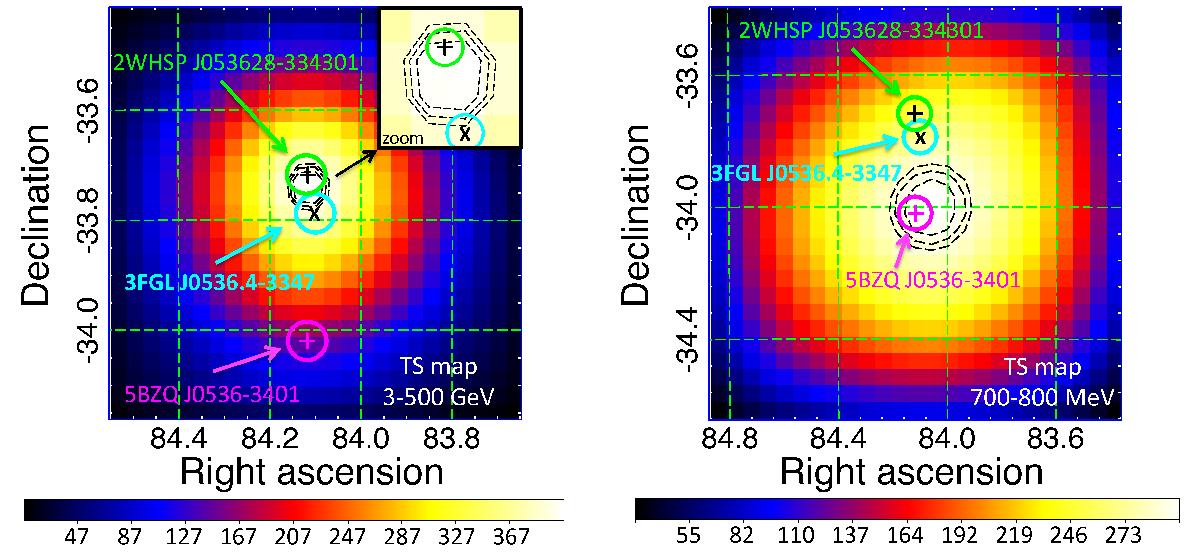
Energy-dependent TS maps indicating three objects in the studied field; 3FGL J0536.4-3347’s position is highlighted with a cyan circle, centered on ×, 2WHSP J053628.9-334301 and 5BZQ J0536-3401 are highlighted with green and magenta circles, centered on + symbol. Contour dashed lines in black (from inner to outer lines) represent the 68%, 95%, and 99% containment region for the γ-ray signature. Left: high-energy TS map (20 × 20, 0.05°/pixel) taking into consideration only 3−500 GeV photons; zooming into central TS-peak region, the source 2WHSP J053628.9-334301 (hard γ-ray spectrum, Γ2WHSP = 1.76) is within the 68% containment region for the high-energy γ-ray signature. Right: lower-energy TS map (20 × 20, 0.08°/pixel) considering only 700−800 MeV photons. In this case, the TS-peak position is dominated by the 5BZQ J0536-3401 (steep γ-ray spectrum source, ΓBZQ = 2.75) well within the 68% containment region for the lower-energy γ-ray signature.
Current usage metrics show cumulative count of Article Views (full-text article views including HTML views, PDF and ePub downloads, according to the available data) and Abstracts Views on Vision4Press platform.
Data correspond to usage on the plateform after 2015. The current usage metrics is available 48-96 hours after online publication and is updated daily on week days.
Initial download of the metrics may take a while.